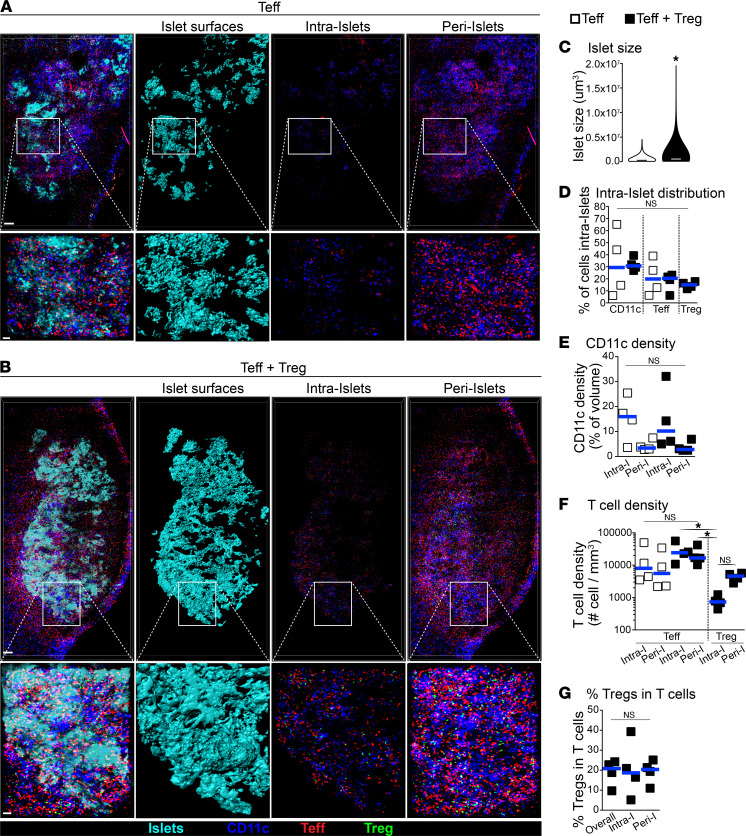
Figure 2. Both Teffs and Tregs are found in APC-rich areas surrounding transplanted islets.
(A and B) Representative 3D-rendered IVM-stitched images of islet allografts and immune cells in mice lacking SLOs (as in Figure 1A) that received Teffs alone or Teffs + Tregs 4 days after cell transfer. Islet surfaces were generated on fluorescently labeled transplanted islets (second column), which distinguishes between intra-islet and peri-islet cellular infiltrates (third and fourth columns, respectively). White squares demonstrate magnified areas shown at the bottom of each panel. Scale bar: 200 μm (top) and 50 μm (bottom). (C) Tregs rapidly protected transplanted islets from rejection by Teffs. Violin plot of individual islet size on day 4 measured from images as in A and B. From measurements of 770–860 individual islets per group (4 mice per group). Mann-Whitney test used. Horizontal bars show median. (D) Fraction of cells within each subset that infiltrated within islets (intra-islet) from images, as in A and B. (E and F) Intra-islet and peri-islet density of CD11c+ cells and T cells from images, as in A and B. (G) Fraction of Tregs in the total T cell infiltrate from images, as in B. Each square in D–G represents data from 1 mouse, and horizontal bars show median. Kruskal-Wallis with Dunn’s multiple comparison tests used in D–G. *P < 0.05.

