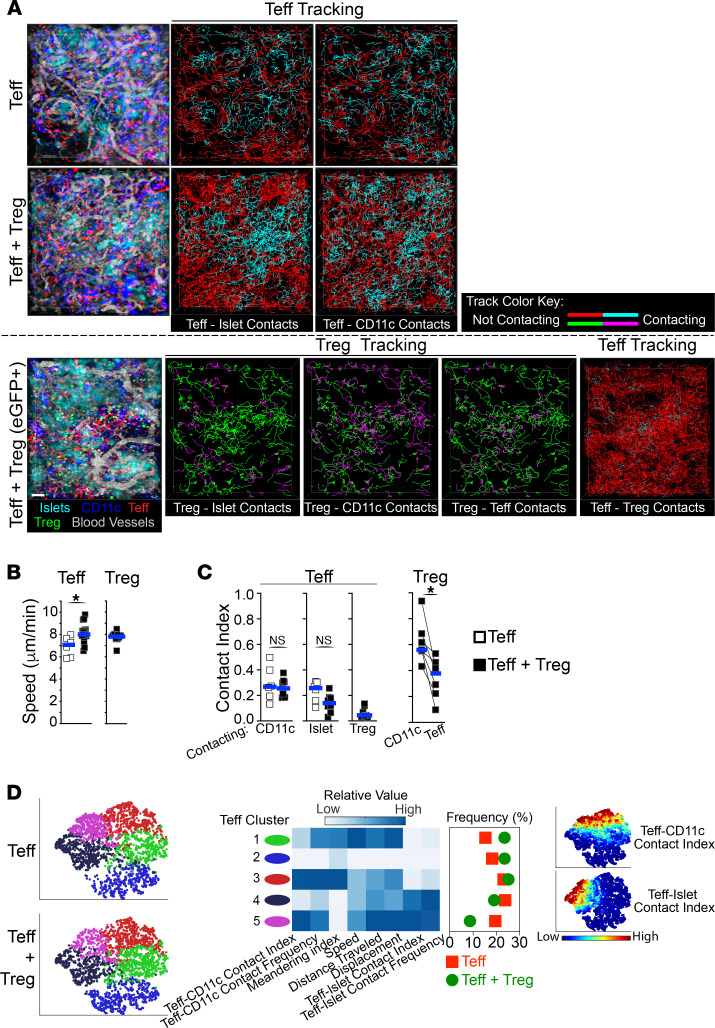
Figure 3. Tregs spend most of their time contacting CD11c+ APCs within islet allografts.
Time-lapse IVM analysis of Teffs, Tregs, APCs, islets, and blood vessel lumens within transplanted islets 4 days after cell transfer of Teffs alone versus Teffs + Tregs (as in Figure 1A). (A) Representative still images (left) and tracking of individual Teffs and Tregs (lines in right panels). Tracking lines color changes to cyan (for Teffs) or to magenta (for Tregs) when in contact with another cell as indicated in each panel. IVM of Teffs + Tregs was performed in setups where Tregs were nonvisible (middle panels) or visible (EGFP+; bottom panels) to allow automated quantification of Teff contacts, as detailed in the Methods section. (B) Tregs increase Teff velocity. Teff and Treg velocity from movies in A. (C) Teffs spend little time in contact with Tregs, while Tregs spend the majority of their time in contact with CD11c+ APCs. Teffs and Tregs contact indexes (i.e., fraction of time spent in contact overall) with CD11c+, islet, Treg, and Teff cells from movies in A. Each square represents mean value from 1 movie, and horizontal bars show median. Mann-Whitney tests used in B and C. (D) Tregs specifically inhibit a subpopulation of Teffs that contacted both CD11c+ and islet cells. ViSNE multiparameter clustering of all Teff tracks from movies in A (left), relative value of individual parameters used in viSNE within each Teff cluster, and frequency distribution of Teff clusters (middle). Right panel depicts Teff contact index value distribution in viSNE plots. n = 3–4 mice per group using 2 or more movies for each mouse. For each movie, an average of 966 Teffs and 342 Tregs were analyzed. Each square in B and C represents the mean value from 1 movie. Horizontal bars show median. *P < 0.05.

