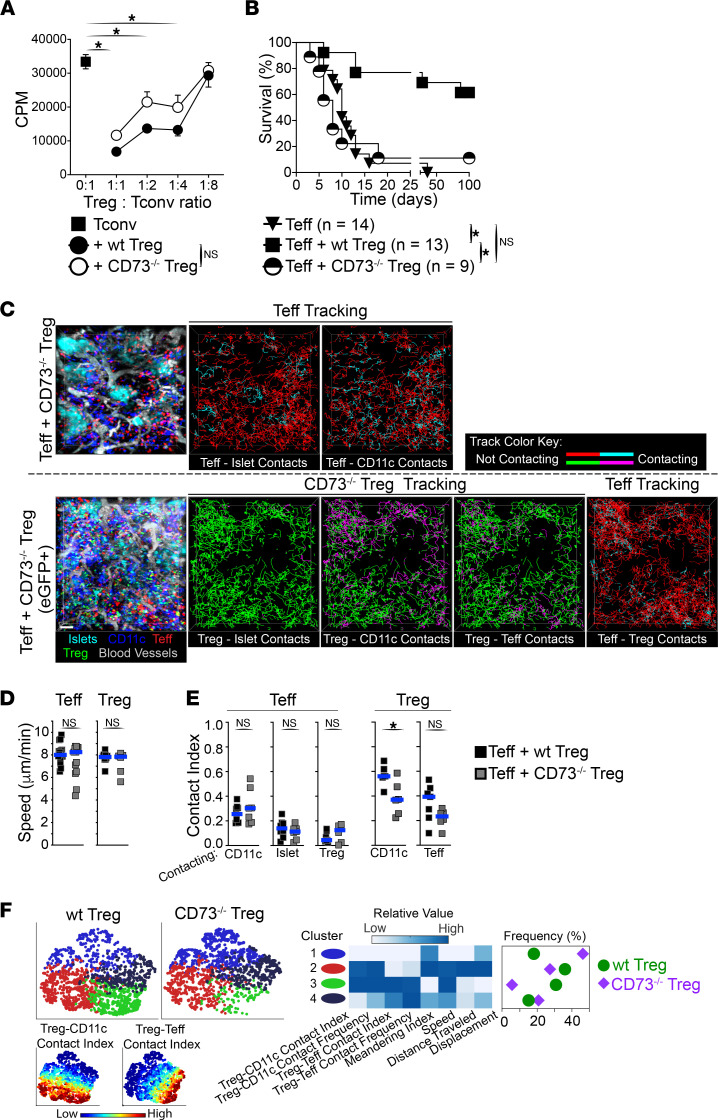
Figure 6. Treg suppressive function within allografts is dependent on the ectonucleotidase CD73.
(A) WT and CD73–/– Tregs are equally suppressive in vitro (results from 2 experiments). Kruskal-Wallis tests used. (B) CD73–/– Tregs fail to protect from rejection within allografts. Graft survival in mice lacking SLOs bearing islet allografts (as in Figure 1A) received cells as indicated. Teff and Teff + WT Treg data are from Figure 1B. Log-rank Mantel-Cox tests used. (C) Time-lapse IVM of Teffs + CD73–/– Tregs within transplanted islets 4 days after cell transfer. Representative stills (left) and tracking of individual Teffs and Tregs (lines in right panels). Tracking line color changes to cyan (for Teffs) or magenta (for Tregs) when in contact with other cells as indicated in each panel. IVM of Teffs + CD73–/– Tregs was performed in setups where Tregs were nonvisible (top panel) or visible (GFP; bottom) to allow automated quantification of Teff contacts (see Methods). (D) Teff and Treg velocity from movies in C (Teffs + CD73–/– Tregs) and Figure 3A (Teffs + WT Tregs). Teff + WT Treg data are from Figure 3B. (E) CD73–/– Tregs contacted CD11c+ APCs significantly less than WT Tregs. Teff, WT Tregs, and CD73–/– Treg contact indexes from movies as in D and from Figure 3C. Mann-Whitney tests used (D and E). (F) The behavior of WT Tregs and CD73–/– Tregs within allografts further differs at subpopulation levels. ViSNE multiparameter clustering of Treg tracks as in D (left), relative value of IVM parameters used in viSNE within each Treg cluster (middle), and frequency distribution of Treg clusters (right). Bottom left: Treg contact index values in viSNE plots. n = 3 mice per group using ≥2 movies per mouse. For each movie, an average of 1120 Teffs and 500 Tregs were analyzed. Squares in D and E represent mean values from individual movies. Horizontal bars show median. *P < 0.05.

