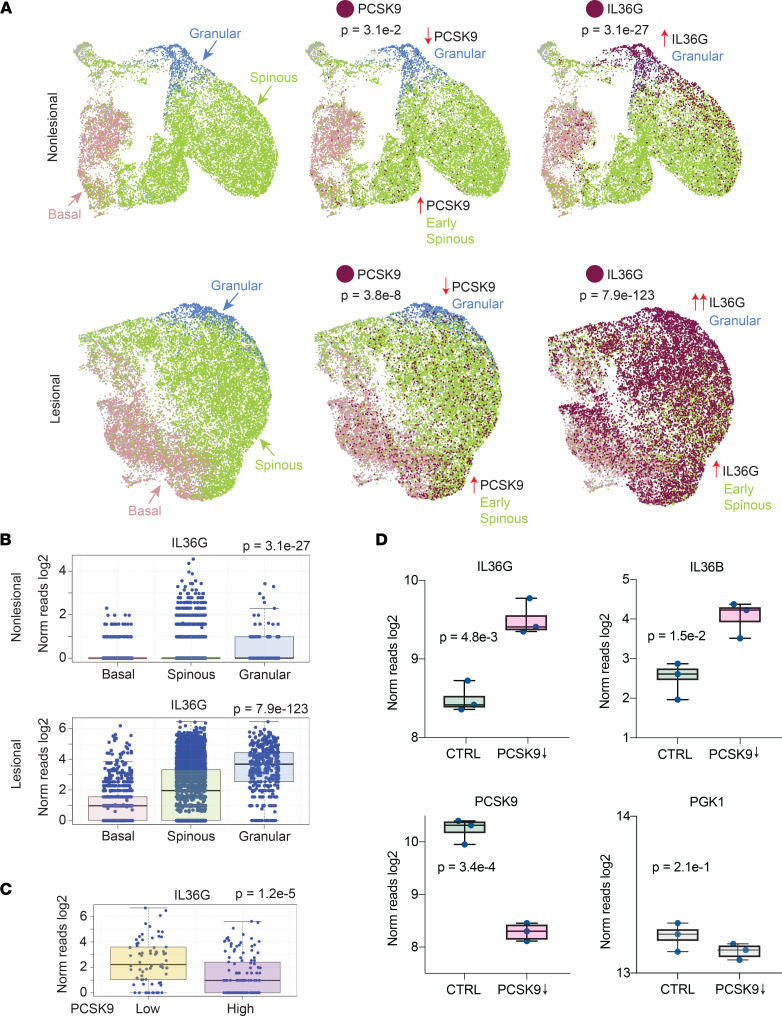
Figure 6. PCSK9 expression is negatively and directly related to IL36B and IL36G expression.
(A) Single-cell sequencing of psoriatic nonlesional and lesional skin (n = 9). The UMAP method was used to create 2-dimensional representation of the resulting data. Keratinocyte populations were identified by the expression levels of established keratinocyte markers (red, basal layer keratinocytes, DST high; green, spinous layer keratinocytes, KRT5 low and KLK7 low; and blue, granular layer keratinocytes, KLK7 high). PCSK9- and IL36G-expressing cells are depicted in maroon. (B) Expression of IL36G in individual basal, spinous, and granular layer keratinocytes shown as box-and-whisker plots of log2 transformed gene expression. P values were calculated for each data set using 1-way ANOVA. (C) PCSK9-positive keratinocytes were parsed into 2 groups, PCSK9-high and PCSK9-low (x axis). Box-and-whisker plots of indicated intracellularly expressed genes are plotted on the y axis (log2 reads). P values were calculated using Student’s t test. (D) Box plots showing the effects of in vitro siRNA knockdown of PCSK9 in keratinocyte cell lines on IL36B and IL36G. PCSK9 (positive control) and PGK1 (negative control) expression is also shown for scrambled siRNA transfected and PCSK9 siRNA transfected cultures. Each dot represents an independently cultured and independently transfected HaCaT keratinocyte cell line (n = 3). P values were calculated with Student’s t test.

