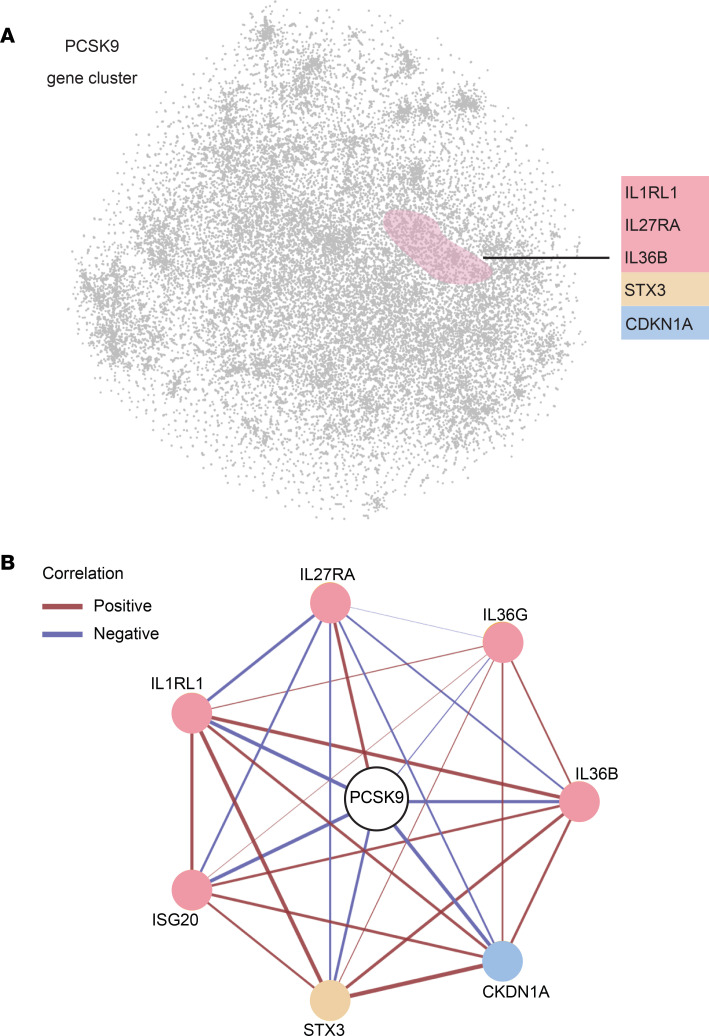
Figure 7. PCSK9 expression clusters with inflammatory mediators of psoriasis.
(A) A 2-dimensional plot of the keratinocyte transcriptome was constructed using a nonlinear dimensionality reduction strategy, the t-SNE method. Each point represents a gene and the distance between the points is inversely related to how well the genes correlate with one another. Within this plot, PCSK9 clusters with various genes of interest, shown on the right of the plot. (B) PCSK9 coexpression network with each circle representing a different gene and the lines connecting each circle representing the strength (thickness of line) and direction (red = positive, blue = negative) of each correlation.

