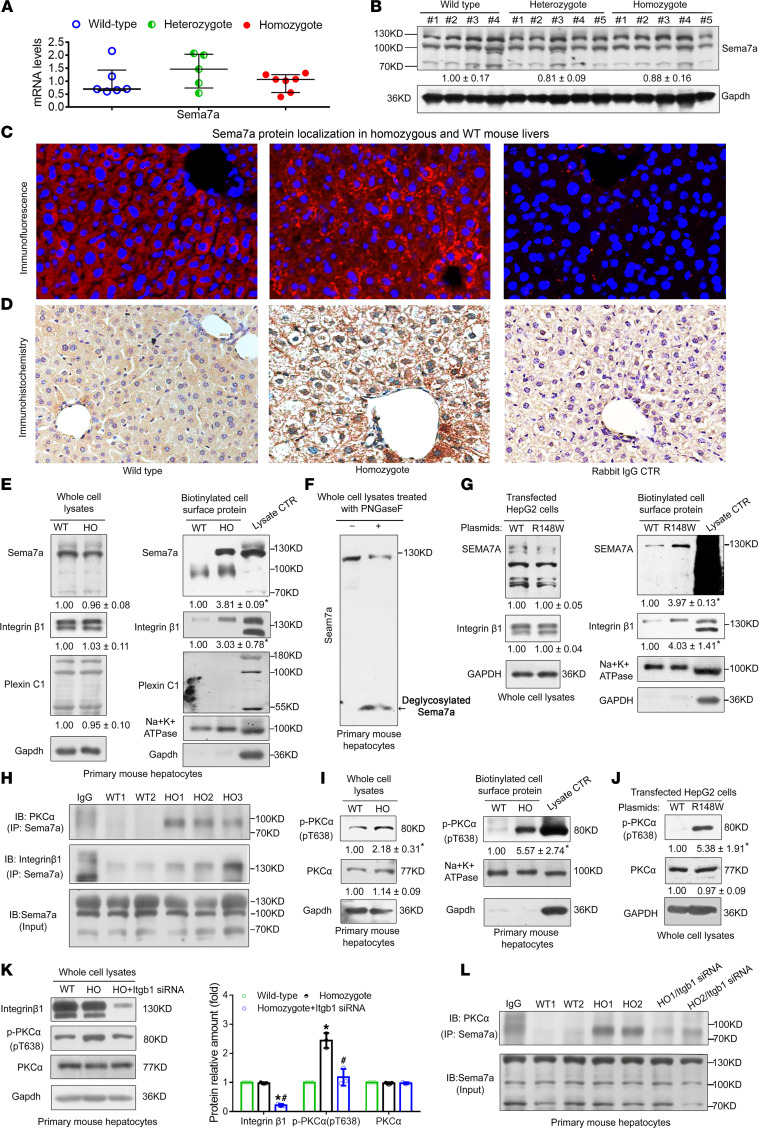
Figure 6. The Sema7aR145W mutation does not alter total Sema7a expression but increases Sema7a and integrin β1 in the cell surface membrane and activates PKC-α signaling in hepatocytes.
Relative levels of Sema7a mRNA transcripts (A) and protein expression (B) in 10-week-old male WT, Sema7aR145W heterozygous, and homozygous mice. One-way ANOVA with post hoc analysis. (C) Immunofluorescence and (D) IHC analyses of Sema7a protein in the livers of WT and Sema7aR145W homozygous mice. Normal rabbit IgG was used as the negative control. Original magnification, ×200. (E) Relative expression levels of Sema7a and its receptors integrin β1 and plexin C1 in whole-cell lysates (left) and membrane fractions (right) extracted from primary mouse hepatocytes. (F) N-glycosylated-Sema7a protein (~130 kDa) was detected in primary mouse hepatocytes. Western blot revealed the deglycosylated Sema7a (black arrow). (G) Relative levels of Sema7a and integrin β1 proteins in whole-cell lysates (left) and membrane fractions (right) from human hepatoma HepG2 cells after transfection with the plasmid for SEMA7A_WT or SEMA7A_R148W. (H) Co-immunoprecipitation analysis of protein interactions among Sema7a, PKCα, and integrin β1 in liver tissues from 10-week-old male WT and Sema7aR145W homozygous mice. (I) Phosphorylated PKC-α (T638) and PKC-α protein levels in whole-cell lysates (left panel) and membrane fractions (right panel) from primary mouse hepatocytes. T638 and PKC-α protein levels in (J) HepG2 cells that were transfected with SEMA7A_WT or SEMA7A_R148W plasmid and (K) primary mouse hepatocytes following integrin β1 silencing. (L) Co-immunoprecipitation analysis of protein interaction between Sema7a and PKC-α in primary mouse hepatocytes after integrin β1 silencing. Data are representative images or expressed as the mean ± SD of each group from 3 separate experiments. The difference among the groups was determined by 1-way ANOVA with Tukey’s post hoc tests or by Kruskal-Wallis test with Dunn’s post hoc test analysis, and the difference between the groups was analyzed by Student’s t test. *P < 0.05 versus WT mice (cells); #P < 0.05 versus Sema7aR145W heterozygous mice (cells).

