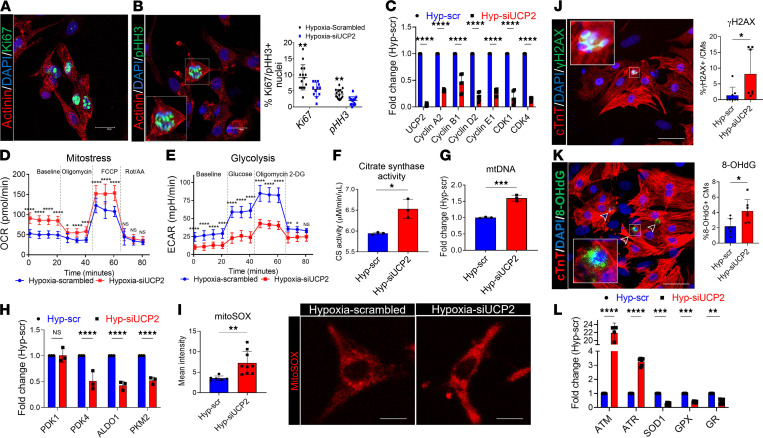
Figure 3. Loss of UCP2 attenuates glycolysis and cell cycle activity, increasing DNA damage in cardiomyocytes under hypoxia.
(A and B) Reduced cell cycle activity in NRVMs under hypoxia treated with 25 nM siUCP2 for 48 hours compared with scrambled siRNA controls and measured by immunostaining for the proliferation markers Ki67 and pHH3. Ki67/pHH3, green; α sarcomeric actinin, red; nuclei, blue. Scale bar: 40 μm (n = 3). (C) mRNA expression levels validating the efficiency of siRNA-mediated silencing of UCP2 and reduced mRNA levels of proliferation marker genes. (D and E) Measurement of oxygen consumption rate (OCR) and extracellular acidification rates (ECAR) by Seahorse Bbioanalyzer show increased mitochondrial respiration and decreased glycolysis, respectively, in NRVMs under hypoxia treated with 25 nM siUCP2 for 48 hours compared with scrambled siRNA controls (n = 12 replicates/condition/3 independent experiments). Data for OCR/ECAR were normalized to cell number. (F–H) Further validation shows increased citrate synthase activity (F) and mitochondrial DNA content (G), as well as decreased mRNA levels of glycolytic enzymes (H) after UCP2 knockdown. (n = 3/condition/experiment). (I) Increased mitochondrial superoxidase production in NRVMs under hypoxia treated with 25 nM siUCP2 for 48 hours compared with scrambled siRNA controls and measured by MitoSOX intensity. Scale bar: 20 μm (n = 3). (J and K) Increased levels of the DNA double-strand breaks marker γH2A.X (J) and the oxidative DNA damage marker 8-OHdG (K) in NRVMs under hypoxia after UCP2 knockdown. 8-OHdG/γH2A.X, green; cardiac troponin T, red; nuclei, blue. Scale bar: 40 μm (n = 3). (L) Increased mRNA expression of DNA damage markers ATM and ATR and decreased antioxidant markers SOD1, GPX, and GR in NRVMs under moderate hypoxia after UCP2 knockdown. (n = 3). *P < 0.05, **P < 0.01, ***P < 0.001, ****P < 0.0001. Data from A–E, H, and L were analyzed using Kruskal-Wallis test with Dunn’s correction for multiple comparisons; for F, G, and I–K, Mann-Whitney U test was applied.

