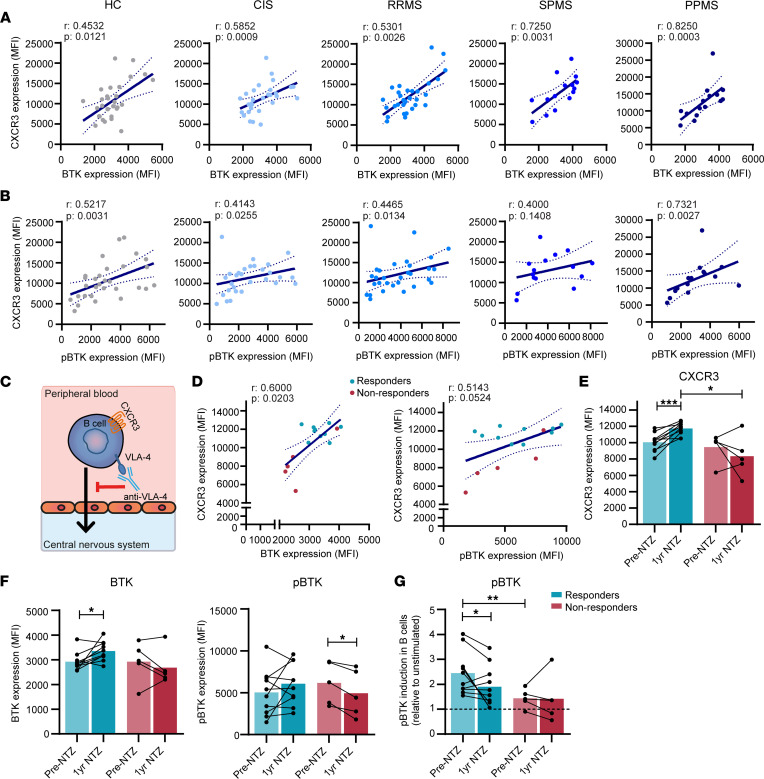
Figure 2. Correlation of BTK and phospho-BTK with CXCR3 expression levels in B cells from patients with MS.
The association of (A) total BTK protein and (B) phospho-BTK with CXCR3 expression was analyzed for blood B cells from healthy control (HC; n = 30), clinically isolated syndrome (CIS; n = 29), relapsing-remitting MS (RRMS; n = 30), secondary progressive MS (SPMS; n = 15), and primary progressive MS (PPMS; n = 15) groups. FACS data were collected in the same number of experiments as depicted in Figure 1. (C) Graphical illustration of natalizumab (NTZ; anti–VLA-4 monoclonal antibody) treatment blocking the migration of CXCR3+ B cells into the CNS. (D–F) Total BTK protein, phospho-BTK, and CXCR3 expression levels were assessed in ex vivo blood B cells from NTZ-treated patients with MS. These were compared between samples from before and 1 year after treatment as well as clinical responders (n = 10) and nonresponders (n = 5). (G) The inducibility of phospho-BTK in B cells from responders and nonresponders before and after NTZ treatment. For the NTZ-treated MS cohort, FACS data were collected in 1 experiment with all patients included. (A, B, and D) Spearman’s correlations and (E–G) both paired t test and Mann-Whitney U tests were performed. *P < 0.05, **P < 0.01, ***P < 0.001.

