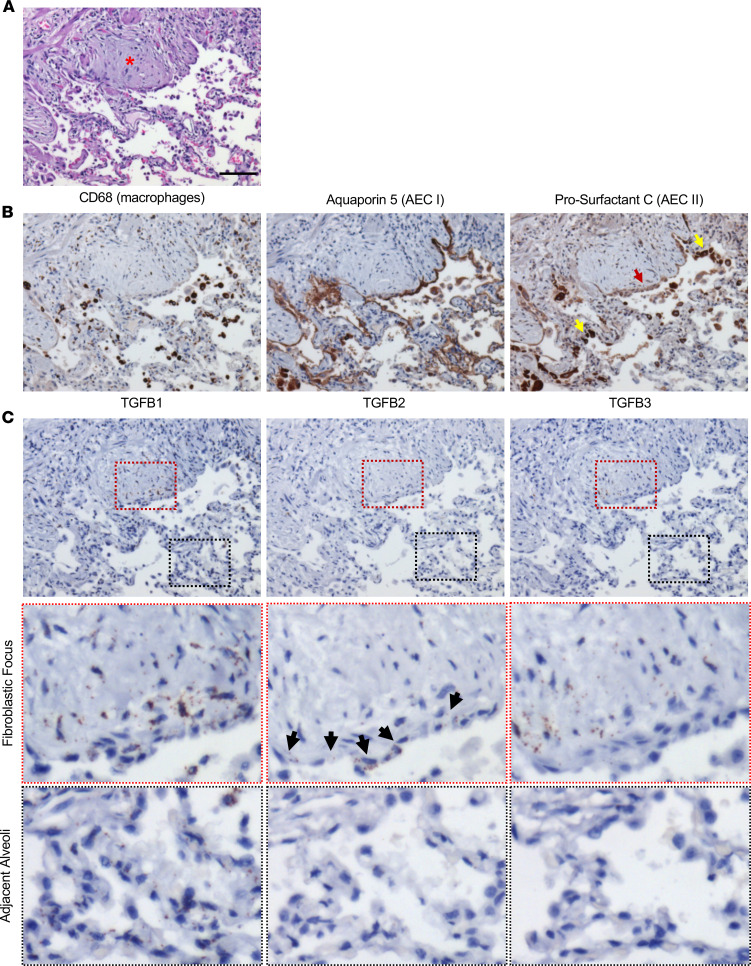
Figure 4. Distribution of type I and II alveolar epithelial cells and TGFB1–3 in the FF and adjacent alveoli.
A UIP/IPF specimen was serially sectioned and histologically stained for (A) H&E (red asterisk denotes the FF). (B) Immunostain for macrophages (CD68), AECI (AQ5), and AECII (pSC). Notice that the epithelial lining of the FF has a faint pSC stain (red arrow) yet strong positive staining elsewhere (yellow arrow). (C) RNA in situ hybridization for TGFB1–3. Notice the epithelial lining of the FF with marked positivity for TGFB2 (black arrows). Scale bar: 100 μm (A–C) (n = 5 UIP/IPF specimens, representative image shown).

