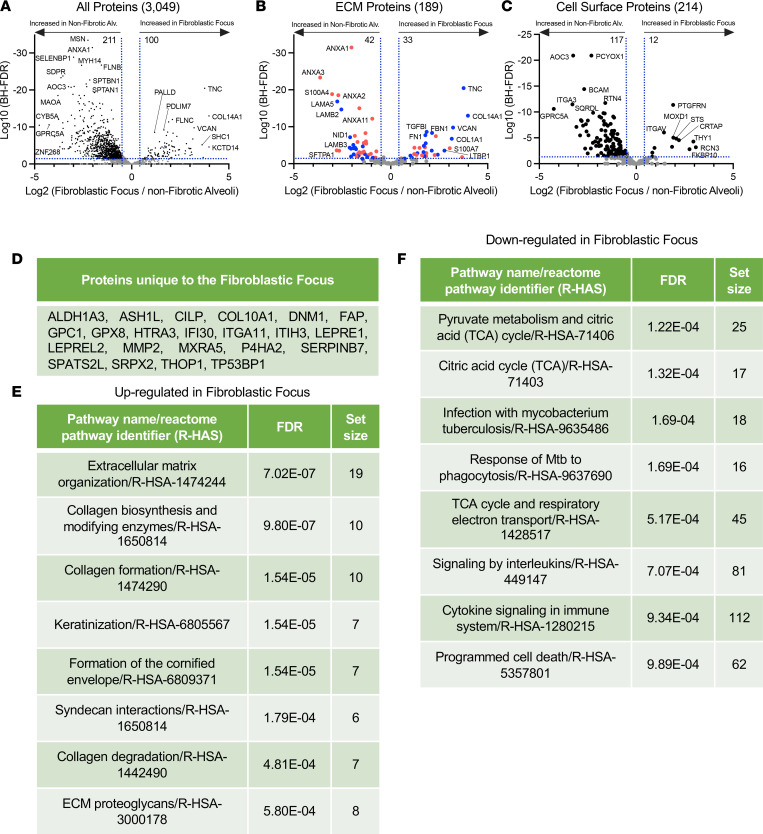
Figure 6. The FF site is an active collagen biosynthesis factory.
(A–C) Volcano plots comparing FF with nonfibrotic alveoli control showing the negative natural log of the FDR values plotted against the base 2 log (fold change) for each protein. The data in A are for all proteins, whereas data in B were matched against the Human Matrisome Project (34) and C were matched against the Cell Surface Protein Atlas (39). (D) Proteins unique to the FF. Reactome pathways showing the most (E) upregulated or (F) downregulated for the FF compared with nonfibrotic alveoli control.

