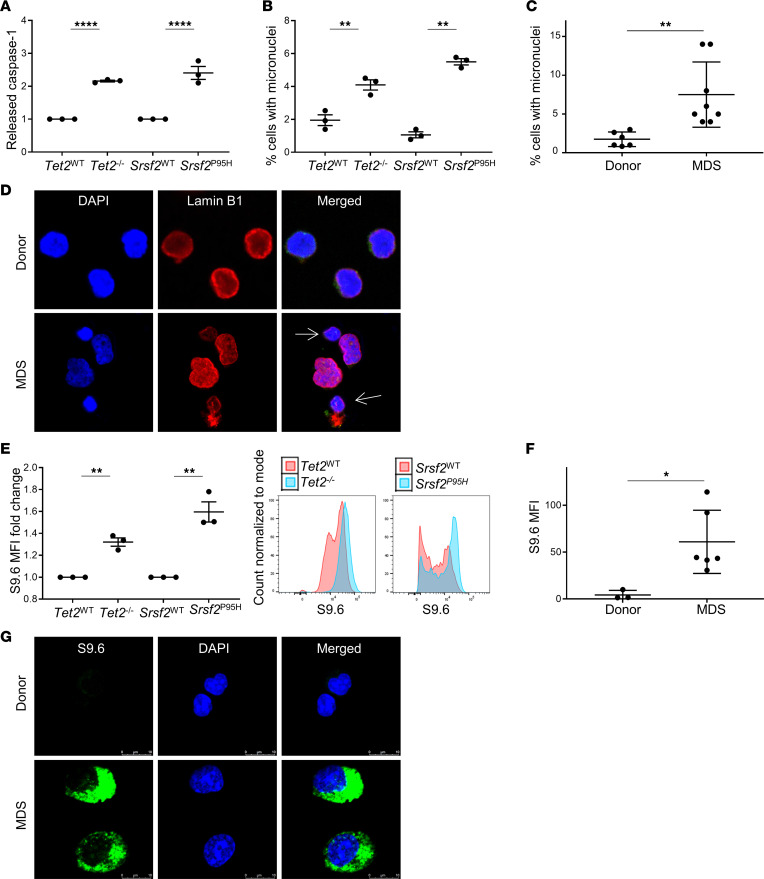
Figure 1. Cytosolic DNA is increased in MDS bone marrow and murine SGM models.
(A) Released caspase-1 was significantly increased in SGM mutant cell lines compared with WT controls; assessed by Caspase-Glo 1 Inflammasome Assay (n = 3 each). (B) Percentage of cells with micronuclei was significantly increased in SGM cell lines compared with WT controls (n = 3 each), as well as in MDS patient BM-MNCs (n = 8) compared with BM donors (n = 6) (C). (D) Representative immunofluorescence images of micronuclei in MDS (n = 8) compared with donor BM-MNCs (n = 6). (E) R-loop expression measured by S9.6 flow cytometry was significantly increased in SGM cell lines compared with WT controls (n = 3 each) as well as in MDS BM-MNCs (n = 6) compared with controls (n = 3): representative histograms. (F) Quantification of immunofluorescence images (G) of R-loops (shown in green) in MDS (n = 6) compared with donor BM-MNCs (n = 3); scale bars: 10 μm. Data are presented as mean ± SEM, Student’s t test, *P ≤ 0.05, **P ≤ 0.01, ****P ≤ 0.0001.

