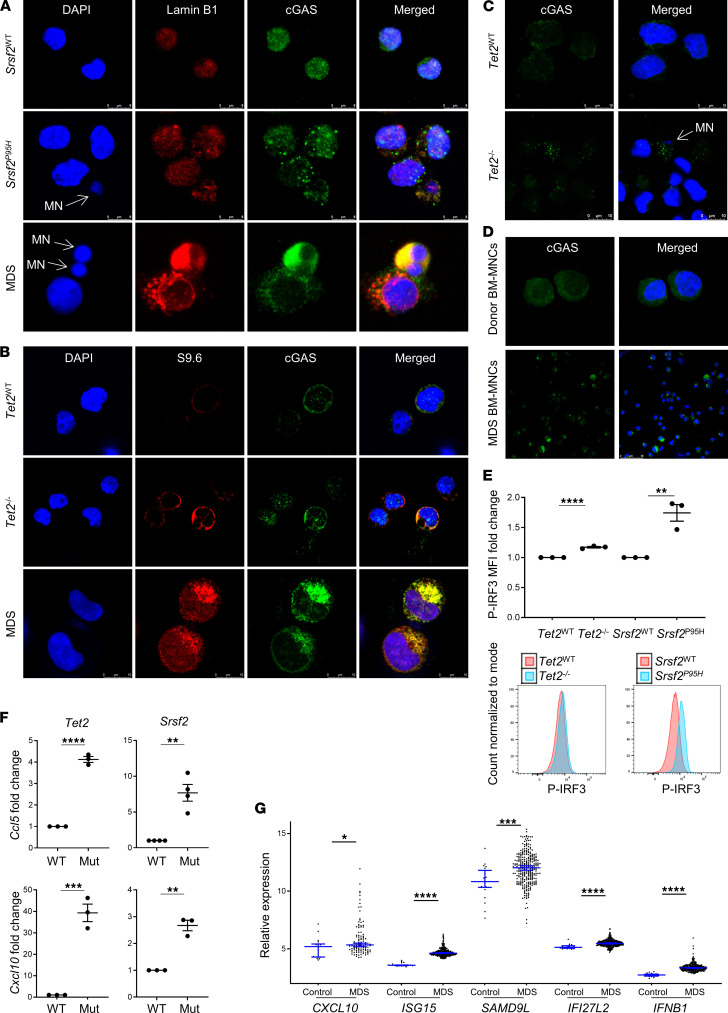
Figure 2. cGAS is activated in SGM models and MDS bone marrow cells.
(A) Representative immunofluorescence images of SGM mutant cell lines and MDS BM-MNCs with colocalization of cGAS to micronuclei with compromised nuclear membranes. Scale bar: 8 μm. (B) Representative immunofluorescence images of colocalization of cGAS and R-loops in SGM mutant cell lines and MDS BM-MNCs. Scale bar: 10 μm. (C) Aggregation of cGAS foci was increased in mutant immortalized SGM cells compared with WT controls (cGAS in green, DAPI in blue; original magnification, 3780×). Scale bar: 10 μm. (D) Aggregation of cGAS in MDS BM-MNCs (original magnification, 630×) compared with donor BM-MNCs (original magnification, 2940×). Scale bar: 50 μm. (E) Phospho-IRF3 was increased in SGM models compared with WT controls; representative flow histograms (n = 3 each). (F) ISG expression was increased in the immortalized SGM cells compared with WT controls (n = 3 each). (G) ISG and IFNB1 expression was significantly increased in MDS BM-MNCs (n = 213) compared with age-matched donors (n = 20). Data are presented as mean ± SEM. Images are representative of at least 2 independent experiments; Student’s t test for in vitro data; Mann-Whitney U test for G; *P ≤ 0.05, **P ≤ 0.01, ***P ≤ 0.001, ****P ≤ 0.0001.

