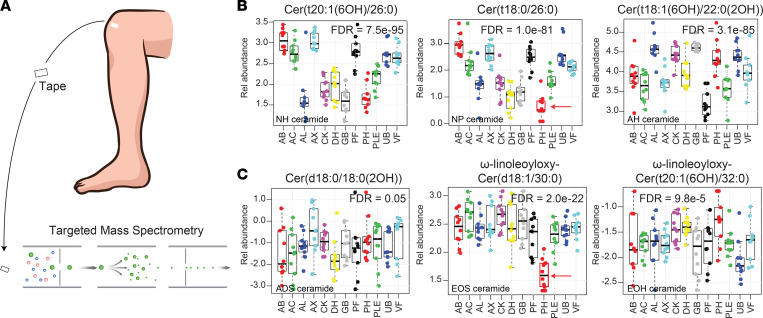
Figure 1. Biogeographical variation of epidermal ceramides.
(A) Analysis of tape-stripping samples by targeted mass spectrometry. (B) The relative abundance of 351 lipids was simultaneously monitored across 12 different anatomic locations; representative ceramides are shown. Sites monitored included abdomen (AB), antecubital fossa (AC), alar crease (AL), axillae (AX), cheek (CK), dorsal surface of the hand (DH), glabella (GB), popliteal fossa (PF), plantar heel (PH), anterior proximal lower extremity (PLE), upper back (UB), and volar forearm (VF). Results are presented as box-and-whisker plots, where the upper and lower bars connected to each box indicate the boundaries of the normal distribution, and the box edges mark the first and third quartile boundaries within each distribution. The dark horizontal line represents the median. The relative abundances of the NH ceramide Cer(t20:1[6OH]/26:0), the NP ceramide Cer(t18:0/26:0), and the AH ceramide Cer(t18:1[6OH]/22:0[2OH]) were highly variable across different anatomic locations. (C) In contrast, the expression of the ADS dihydroxyceramide Cer(d18:0/18:0[2OH]) was largely invariable across all anatomic sites, a finding representative of all ADS ceramides monitored (Supplemental Table 1). Acyl-ceramides EOS ω-linoleoyloxy-Cer(d18:1/30:0) and EOH ω-linoleoyloxy-Cer(t20:1[6OH]/32:0) are also shown. Note the low expression of the EOS ceramide in PH epidermis, which was a typical finding for EOS ceramide expression (Supplemental Table 1).

