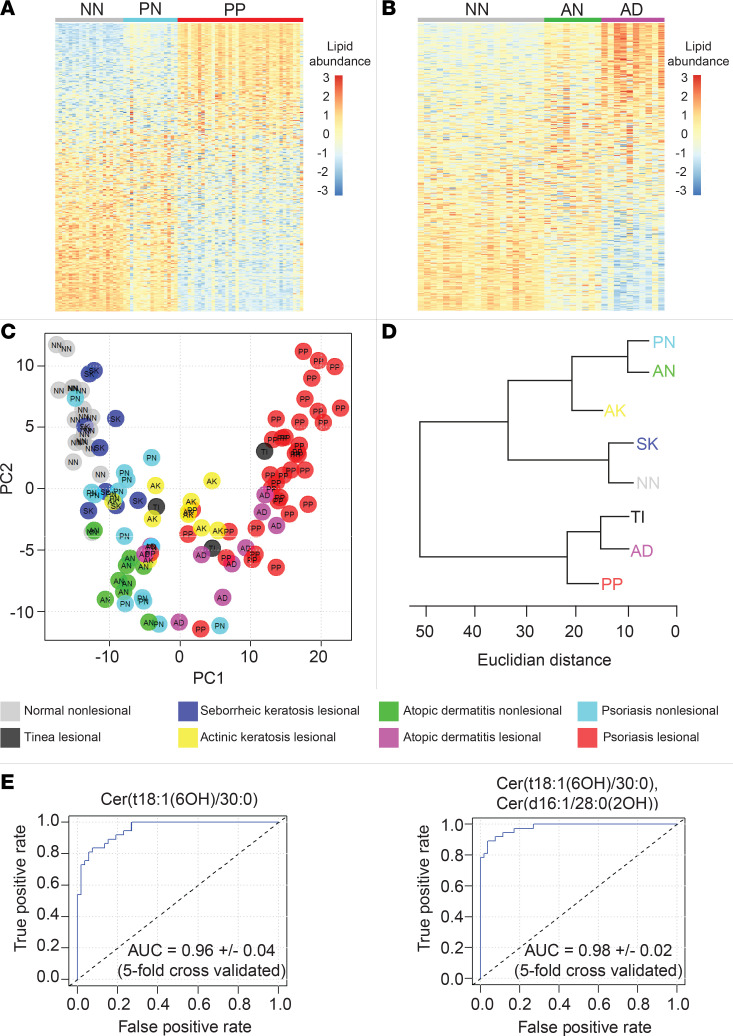
Figure 10. Epidermal lipid expression can diagnose skin diseases.
Tape strippings were performed on lesional skin and control healthy skin. Each column represents a stratum corneum tape-stripping sample (grouped by diagnostic category). (A) Heatmap of lipid abundance in psoriasis (NN = normal healthy skin [gray, n = 20], PN = nonlesional psoriasis skin [blue, n = 16], and P = lesional psoriasis skin [red, n = 37]). Each row represents a monitored lipid, with red representing increased expression and blue representing decreased expression. Rows were sorted by standard mean difference (SMD). To construct heat maps to compare lipid abundances, lipid peak intensity values were preprocessed using the “scale and center” function in R, which subtracts the mean value of the analyte and divides the result by the standard deviation for that analyte. (B) Heatmap of lipid abundance in atopic dermatitis (AN = nonlesional atopic dermatitis skin [green, n = 10] and AD = lesional atopic dermatitis skin [purple, n = 9]). (C) Principal component analysis of relative lipid abundance data. Each dot represents 1 epidermal sample. Each color represents a diagnostic group (normal healthy skin [light gray], psoriasis lesional [red], psoriasis nonlesional [light blue], atopic dermatitis lesional [purple], atopic dermatitis nonlesional [green], actinic keratosis lesional [yellow], seborrheic keratosis lesional [dark blue], and tinea lesional [dark gray]). (D) Cluster dendrogram with Euclidian distance represented on the horizontal axis (AD, atopic dermatitis lesional; AK, actinic keratosis lesional; AN, atopic dermatitis nonlesional; NN, normal healthy skin; PN, psoriasis nonlesional; PP, psoriasis lesional; TI, tinea lesional). (E) Left: Receiver operating characteristic curve (ROC) for the single analyte classifier, NH ceramide Cer(t18:1[6OH]/30:0), demonstrates its ability to distinguish psoriatic lesional skin (PP) from all other diagnostic groups (NN, PN, PP, AK, SK, TI, and AD) combined (AUC, 0.96). Right: ROC for the 2-analyte classifier, NH ceramide Cer(t18:1[6OH]/30:0) + AS ceramide Cer(d16:1/28:0[2OH]), capable of distinguishing psoriatic lesional skin from all other diagnostic groups combined. The AUC for the 2-analyte classifier was 0.98 ± 0.02 (5-fold cross-validated).

