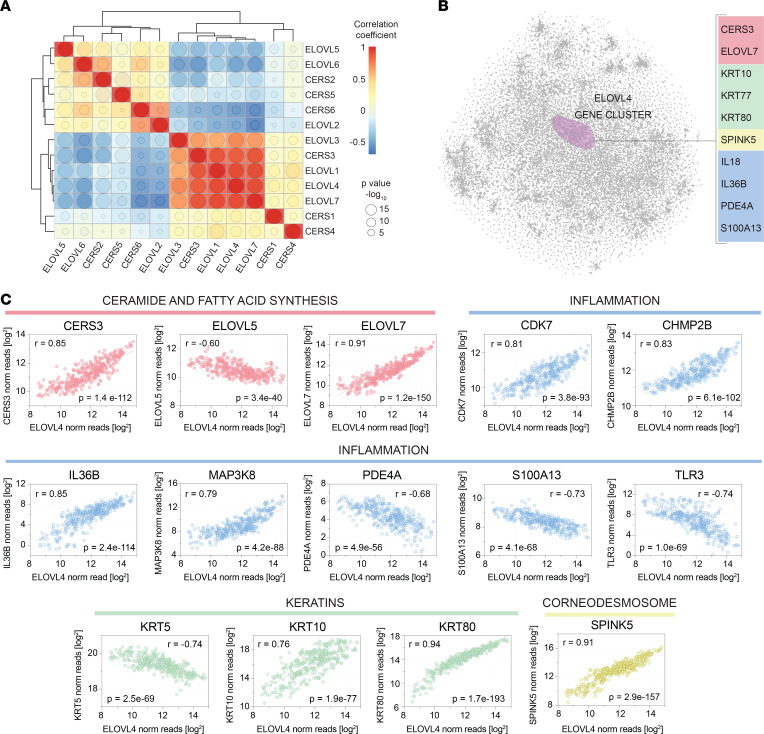
Figure 13. The ELOVL4 expression correlates with immune and skin barrier genes.
(A) Hierarchical clustering of lipid genes by their expression yields 2 clear clusters, one centered on ELOVL4 and the other on ELOVL6. The lipid genes coexpressed with ELOVL4 include ELOVL1, ELOVL3, ELOVL7, and CERS3. These genes negatively correlated with the lipid-genes within the ELOVL6 cluster (ELOVL5, ELOVL6, CERS2, CERS5, CERS6, and ELOVL2). The size of the circle within each box is proportional to the significance of the intersecting lipid-lipid correlation, while the color represents the correlation coefficient of the comparison. (B) The t-SNE nonlinear dimensionality reduction method was used to create a 2-dimensional plot of the keratinocyte transcriptome from RNA-Seq data obtained from 50 primary human keratinocytes cell lines. Within this plot, each point represents a keratinocyte-expressed gene, and the distance between the points is inversely related to how strongly the genes correlated with one another. Representative genes that cocluster with ELOVL4 are listed on the right, and they include various inflammatory mediators (e.g., IL36B, in blue). (C) Individual gene expression scatter plots reveal strong correlations between the expression of ELOVL4 (x axis) and representative coclustering genes (y axis). In these plots, each dot represents a unique in vitro cultured primary human keratinocyte cell line and culture condition (50 unique primary human keratinocyte cell lines were each cultured under 8 different conditions; see Supplemental Methods). ELOVL4 strongly correlated with lipid genes involved in ceramide and fatty acid synthesis (pink), as well as select keratin (green) and corneodesmosone-related (yellow) genes. Note the strong correlation between ELOVL4 and various immune-related genes (blue).

