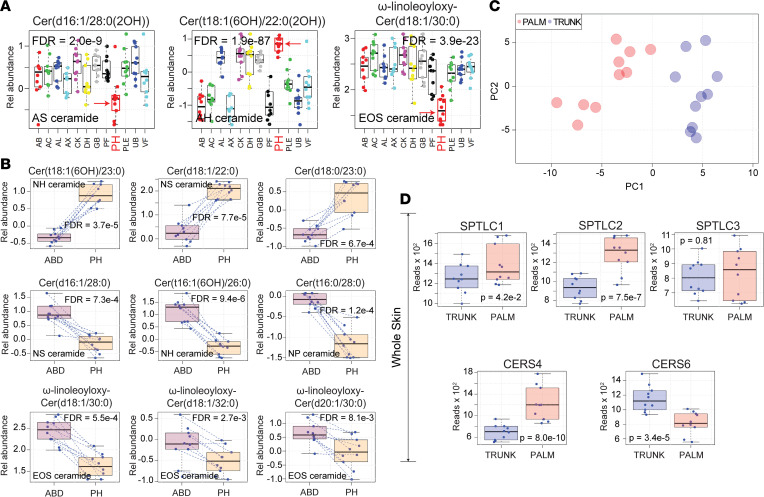
Figure 4. Palmoplantar skin has a unique epidermal lipid composition.
(A) Results are displayed as box-and-whisker plots, as described in Figure 1. Representative lipids were chosen to highlight the differences in lipid composition between PH (red arrow) and other anatomic locations. Note the low abundance of AS ceramide Cer(d16:1/28:0[2OH]) in PH skin and the increased abundance of AH ceramide Cer(t18:1[6OH]/22:0[2OH]). This pattern was also observed for all monitored ceramides with similar length sphingoid and fatty acid moieties (Supplemental Figure 2 and Supplemental Table 1). The acyl-ceramide EOSω-linoleoyloxy-Cer(d18:1/30:0) was also decreased in PH epidermis. (B) Additional examples of differentially expressed ceramides in PH skin that follow the same trends as presented in A. (C) Principal component analysis of lipid-associated metabolic gene expression data revealed complete separation of samples by anatomic location. (D) Whole-tissue RNA-Seq performed on palm and trunk biopsy specimens identifies differentially expressed lipid-associated metabolic genes. Genes presented here are relevant to the synthesis of the differentially expressed ceramides in PH epidermis presented in A and B.

