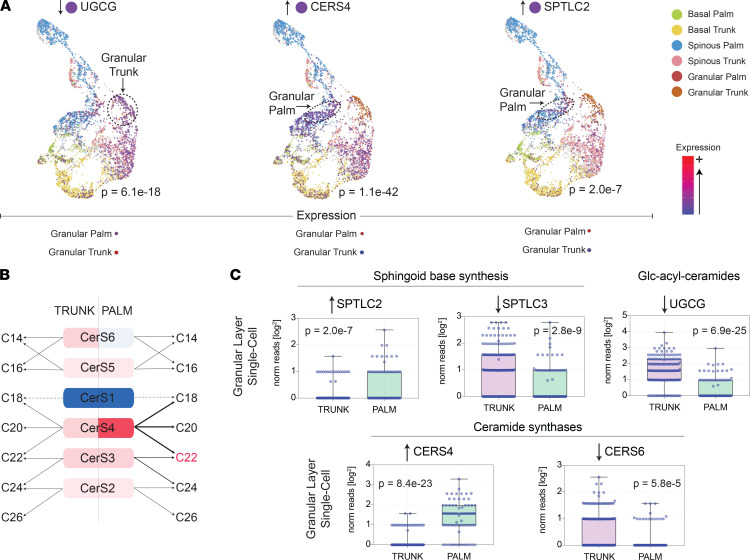
Figure 5. Differential expression of lipid-associated metabolic genes assessed by single-cell sequencing.
(A) Individual keratinocyte transcriptome data are presented using the uniform manifold approximation and projection (UMAP) method. Each dot represents an individual keratinocyte. Note that keratinocytes originating from the same anatomic location and epidermal layer cluster together (basal [palm, green; trunk, yellow], spinous [palm, blue; trunk, pink], and granular [palm, red; trunk, orange] layers). Cells expressing the noted lipid-associated are depicted in purple. Dashed circles are drawn around the keratinocyte population, in which the expression of the noted gene is most strongly upregulated. (B) Predicted alterations in ceramide lipid expression based on ceramide synthase gene expression in trunk versus palm skin. (C) Single-cell RNA-Seq data of palm and trunk epidermal granular layer keratinocytes presented as box-and-whisker plots. Genes selected for presentation are relevant to the observed lipid alterations in PH skin. Each individual data point represents the number of reads that mapped to the indicated gene in a unique granular layer keratinocyte.

