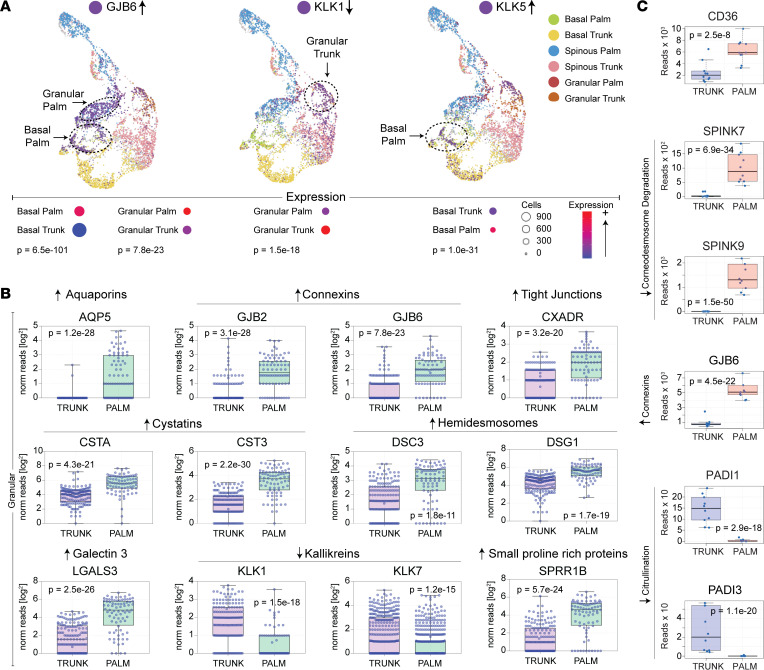
Figure 6. Transcriptome alterations in acral keratinocytes provide insight into the distinctive epidermal features of palmoplantar skin.
(A) UMAP dimensionality reduction plots of single-cell RNA-Seq data. Single-cell RNA-Seq was performed on keratinocytes isolated from paired palm and trunk skin biopsies. Each dot represents an individual keratinocyte (basal [palm, green; trunk, yellow]; spinous [palm, blue; trunk, pink]; and granular [palm, red; trunk, orange] layers). Cells expressing the noted gene of interest are depicted in purple. Dashed circles are drawn around the keratinocyte population in which the expression of the noted gene is most strongly upregulated. Arrows to the left of gene names represents the directionality of gene expression in acral keratinocytes. (B) Single-cell RNA-Seq data presented as box-and-whisker plots. Each individual data point represents the number of reads that mapped to the indicated gene in a single granular layer keratinocyte. (C) Paired biopsies obtained from palm and trunk skin were evaluated by RNA-Seq. Results of select genes relevant to keratin citrullination and corneodesmosome degradation are presented as box-and-whisker plots.

