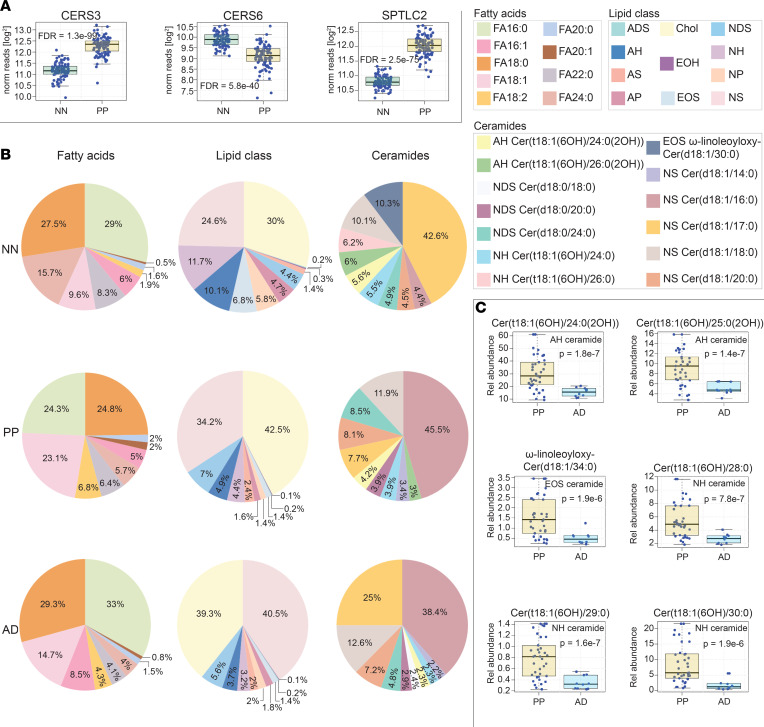
Figure 9. Similarities and differences between the lipid alterations seen in atopic dermatitis and psoriasis.
(A) Whole-tissue RNA-Seq of psoriasis lesional skin identifies differentially expressed lipid-associated metabolic genes. Results are presented as box-and-whisker plots. (Additional gene expression data is presented in Supplemental Figure 8.) (B) Pie charts of epidermal lipid expression in control healthy skin, lesional atopic dermatitis skin, and lesional psoriasis skin. Note that 100% equals the combined abundance for listed lipids, not all epidermal lipids. The pie charts on the left are of representative fatty acids. The relative abundances of cholesterol and ceramides subclasses are depicted in the pie charts in the center. Pie charts on the right are of representative ceramides. Note that the strong upregulation of NS ceramide Cer(d18:1/16:0) in psoriasis makes it difficult to appreciate changes in other ceramide structures. (C) Examples of differentially expressed epidermal ceramides in psoriasis versus atopic dermatitis.

