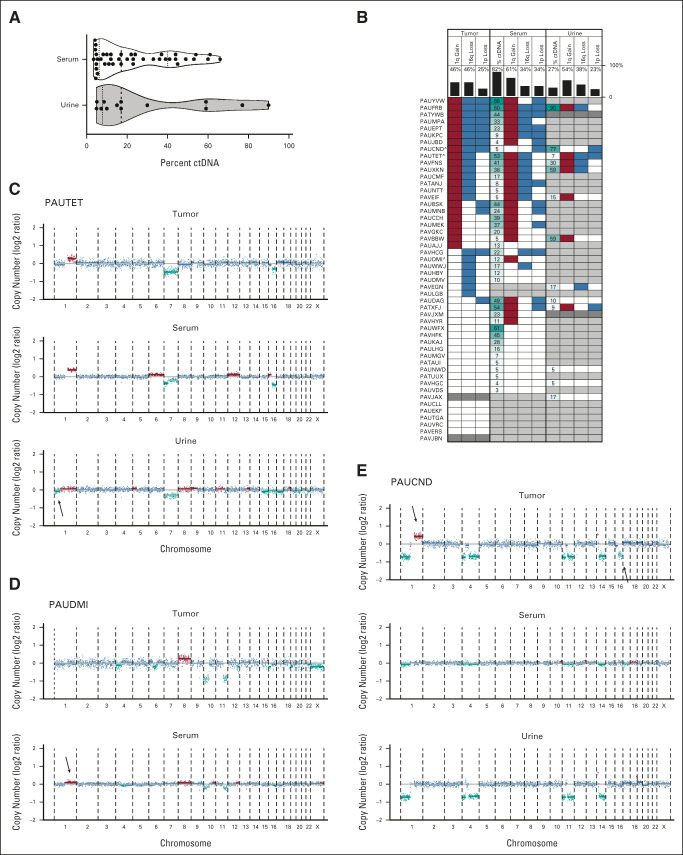
FIG 1.
Detection of ctDNA by identification of copy-number variants in serum and urine of patients with WT. (A) Violin plot of ctDNA levels in serum and urine samples restricted to cases with ctDNA above the limit of detection by ULP-WGS. Dashed vertical line within each violin plot indicates the median and the dotted lines indicate the boundaries between the first and second quartiles and the third and fourth quartiles. Probability densities are reflected by the upper and lower borders of the violin plot. Individual ctDNA data are indicated by black dots. (B) Summary of CNAs in chromosomes 1p, 1q, and 16q by case across sample types. Tissue is indicated at the top of the plot, data type indicated in the column label, and vertical black bars indicate the percent of total evaluable samples containing the variant (or with detectable ctDNA). Red blocks indicate copy gains, blue indicates copy losses, white indicates that a variant was not detected, dark gray indicates an unevaluable sample (no tissue or insufficient DNA for sequencing), and light gray indicates that no ctDNA was detectable in the sample. Percent ctDNA content indicated by number with higher ctDNA content shaded in dark teal and lower ctDNA by light teal. Cases plotted in (C-E) include “a” in the patient identifier. (C-E) Genome-wide plots represent the log2 ratio for each data point with blue data equivalent to two copies of the genomic location, teal equal to copy-number loss, and red equal to copy-number gains. Chromosomal segmental medians are also plotted as horizontal lines with light teal segments representing likely subclonal events. Arrows indicate CNAs that are not present in all matched samples from the patient. Case identifiers are present at the top of the panels. CNA, copy-number alteration; ctDNA, circulating tumor DNA; WT, Wilms tumor.

