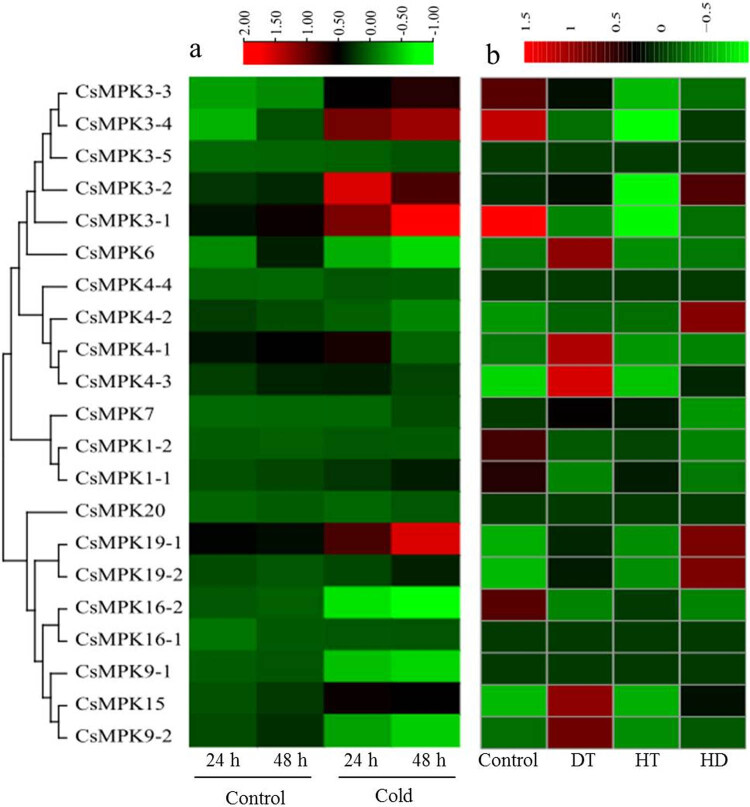
Figure 5.
Hierarchical clustering of the expression patterns of CsMPK genes in tea plant leaves under cold, drought, heat, and heat combined with drought stresses. The red and green colors indicate higher or lower expression levels, respectively. (a) Heatmap of the CsMPK genes expression under cold treatment. (b) Heatmap of the CsMPK genes expression under drought, heat, and heat combined with drought treatments. DT, HT, and HD were denoted as drought, heat, and heat combined with drought treatments, respectively.

