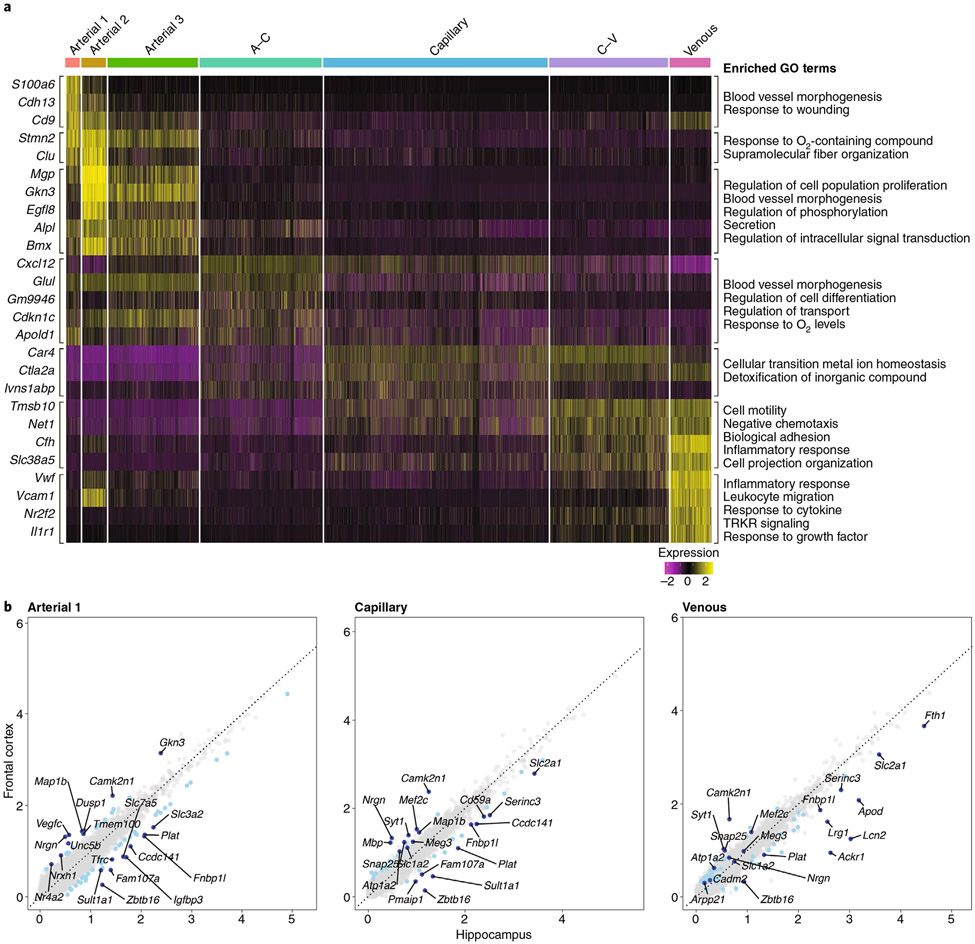
Fig. 3 ∣. Endothelial expression heatmap and scatter plot of differentially expressed genes in the neocortex and the hippocampus.
a, Analysis of single-cell RNA-seq data from the Saunders database of whole-brain endothelial cells15. The heatmap shows scaled, log-normalized expression of the top discriminative genes per endothelial cell cluster (left) identified using the SEURAT toolkit. The color bar (top) denotes assignment for endothelial cells ordered by position in the vascular tree according to validated markers13,17. On the right, the GO terms that define the biological process in which the differentially expressed genes may be involved are presented. GO terms were derived from the biological process subset of MSigDB’s v7.1 GO gene sets (C5) for Mus musculus. All significant differentially expressed genes were used for analysis, and resulting pathways with a false discovery rate q-value of <0.05 are presented (see Supplementary Methods for details). b, Scatter plot of differentially expressed genes in neocortical and hippocampal endothelial cells. Comparative analysis of endothelial genes (gray dots) scaled, log-normalized expression in the frontal cortex and the hippocampus mined from the Saunders database15. Differentially expressed genes between the frontal cortex and the hippocampus are indicated in light blue, with the top ten most regulated genes indicated in dark blue. The GO terms referring to these differentially expressed genes are presented in Supplementary Table 1 (see Supplementary Methods for details).

