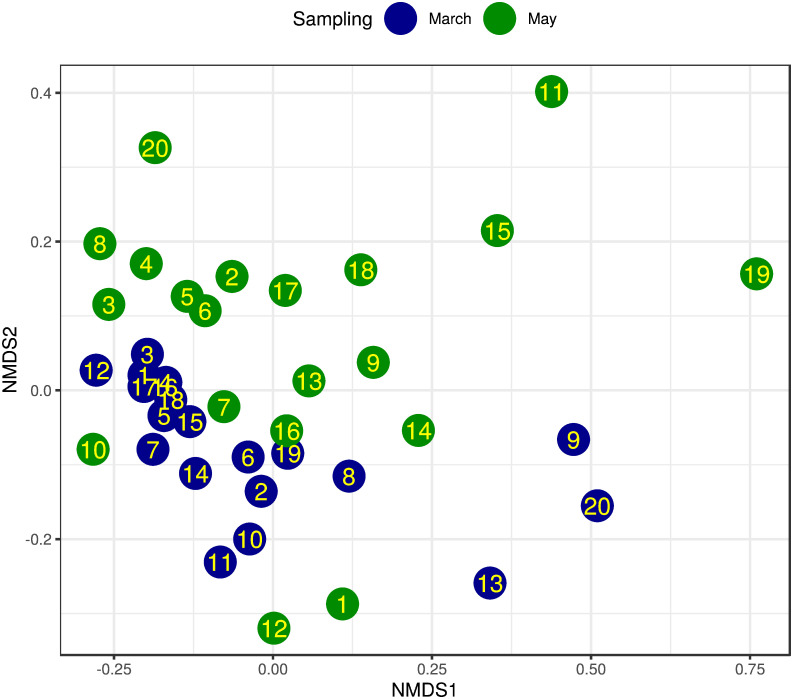
Fig 3. NMDS ordination of bacteriome for sampling March and May.
Bray-Curtis dissimilarity was calculated using the species-level abundance of core bacteria. The samples from apiaries (IDs in dots) collected in March (blue) and May (green) are plotted using these dissimilarities. Based on the same measures, PERMANOVA analysis showed significant differences between the sampling time periods (p = 0.002, stress = 0.144).

