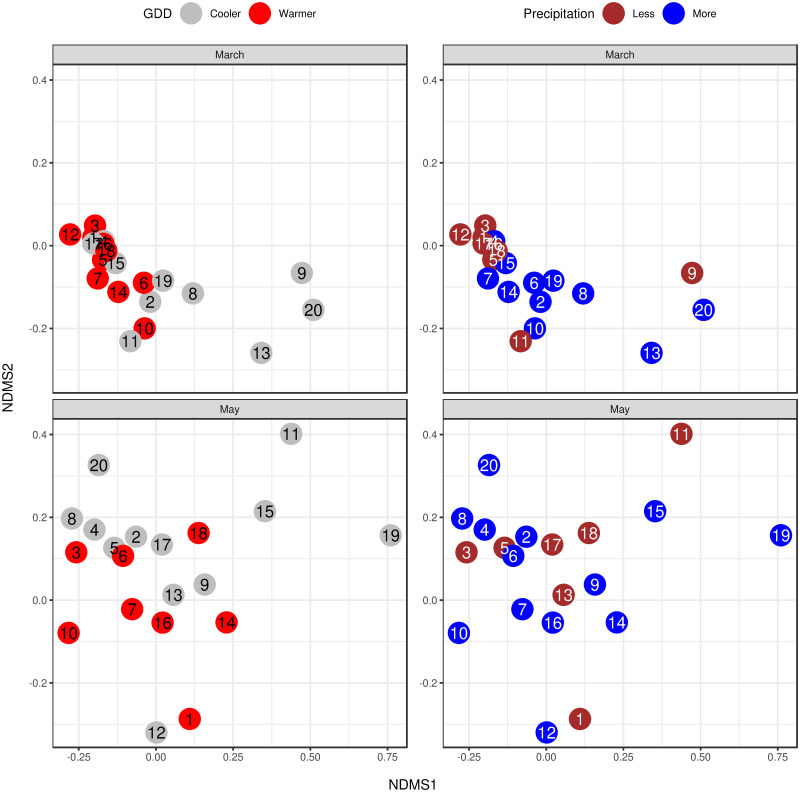
Fig 4. NMDS ordination of bacteriome for environmental condition categories by sampling period.
The colours represent the environmental condition categories and the numbers correspond to the apiary IDs. The stress was 0.062 and 0.116 for March and May respectively. The samples’ bacteriome from March showed significant (p = 0.02) distance between the cooler and warmer districts. From the same period, the precipitation levels did not differ significantly (p = 0.155). In the samples gathered in May, there was no significant distance neither between GDD nor precipitation categories (p = 0.277 and p = 0.849, respectively).

