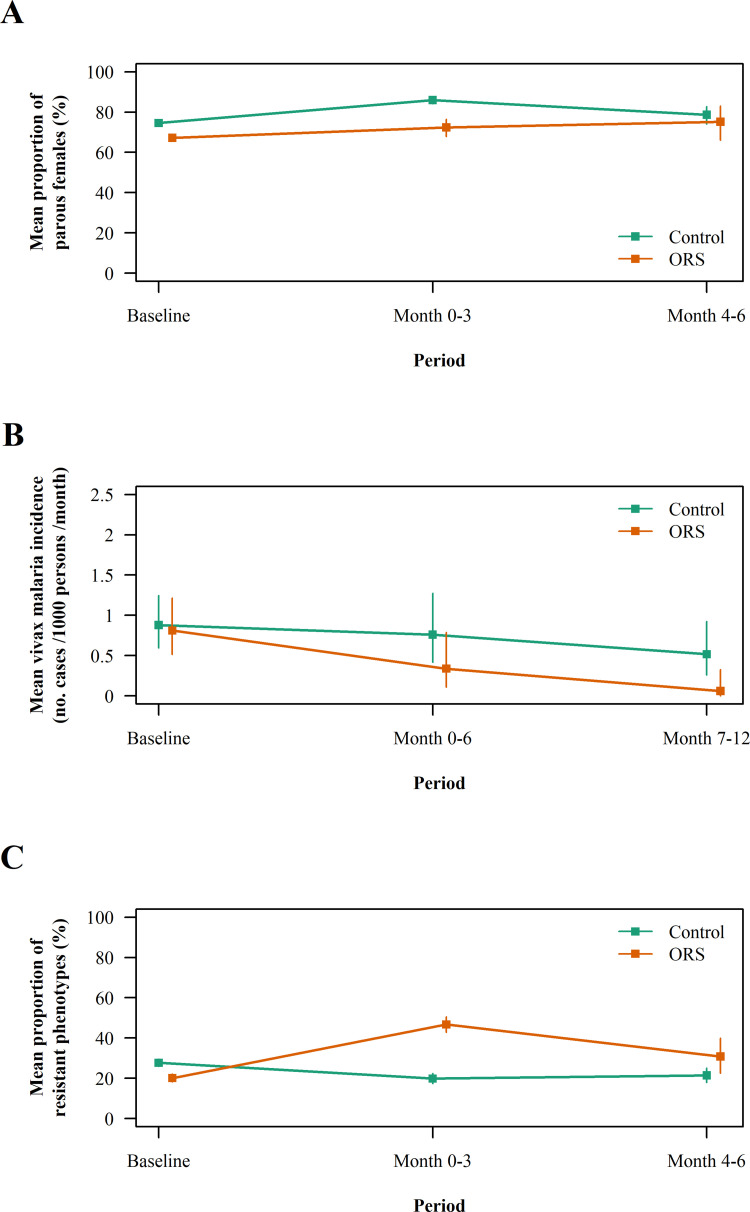
Fig 3. Evolution of the secondary outcomes in the village of the ORS and no intervention groups.
(A) Mean proportion of parous Anopheles females, (B) mean incidence of vivax malaria and (C) mean proportion of lambda-cyhalothrin resistant phenotypes in Anopheles of the control and sprayed villages during the study. Vertical bars show the 95% confidence intervals.

