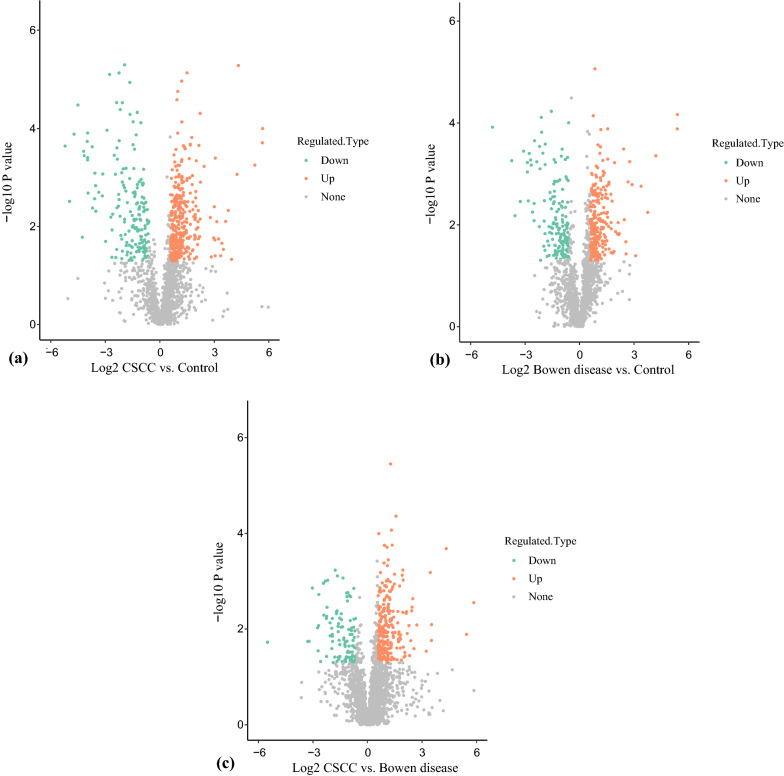
Fig. 3.
In the volcano plot, the red dot indicated a significantly upregulated protein and the blue dot indicated a significantly down regulated protein. The p-value was calculated using the two-sample t-test method. WhenP-value < 0.05, the difference expression amount changed by more than and less than 1.5 as a significantlyup-regulated and down-regulated change threshold, respectively. a When compared with healthy control, 332proteins were down-regulated and 169 proteins were up-regulated in CSCC. b In addition, a total of 246 proteinswere up-regulated and 154 proteins were down-regulated in the Bowen disease relative to the healthy control. c On the other hand, a total of 252 proteins were up-regulated and 104 proteins were down-regulated in the CSCCrelative to the Bowen disease

