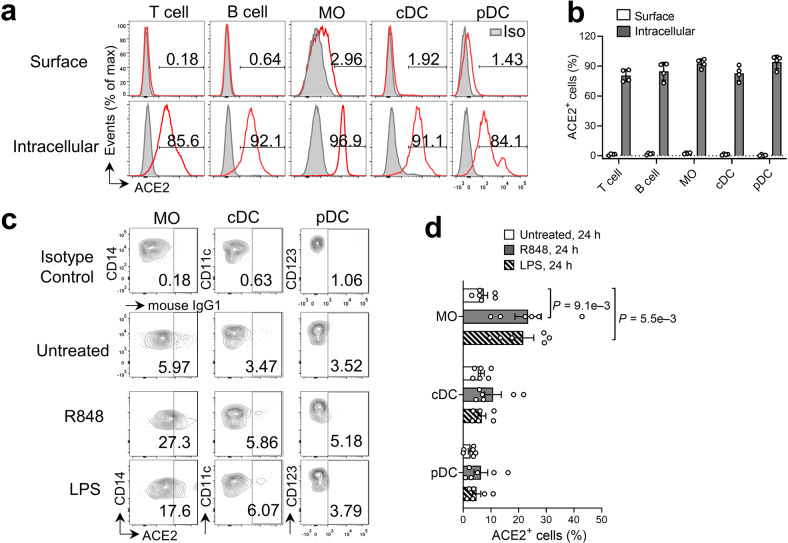
Fig. 1. Upregulation of ACE2 expression on the cell surface of peripheral blood myeloid populations upon ex vivo TLR stimulation.
a Representative flow cytometry analysis of ACE2 protein expression (red line) in T cells, B cells, CD14+ MO, cDCs, and pDCs from fresh PBMCs isolated from healthy donors. Mouse IgG1 antibody (gray tinted) was used as isotype control. b Frequency of cells expressing cell surface and cytoplasmic ACE2 as in (a) (n = 4 biologically independent samples/group). c PBMCs were cultured ex vivo with or without R484 or LPS for 24 h, followed by flow cytometry analysis of surface ACE2 in CD14+ MO, cDCs, and pDCs. Mouse IgG1 antibody was used as the isotype control. d Frequencies of indicated cell types expressing surface ACE2 as in c (n = 6 biologically independent samples/group). cDC classical dendritic cells, pDC plasmacytoid DCs, MO monocytes, LPS lipopolysaccharide.

