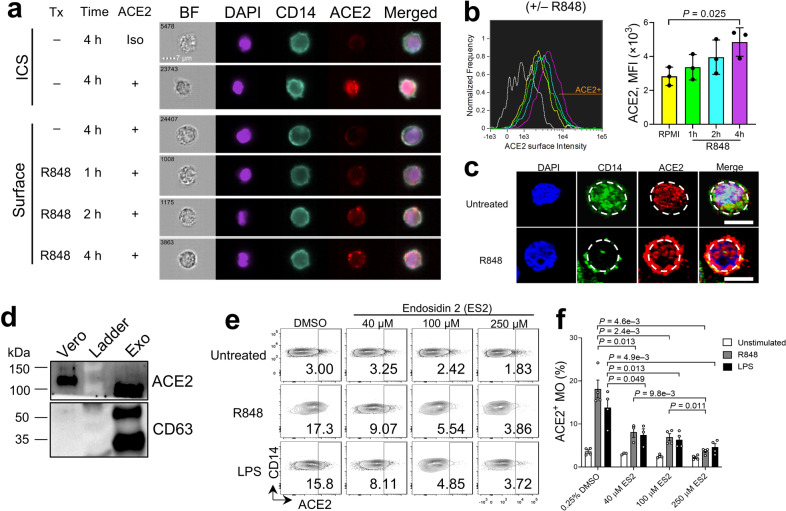
Fig. 2. Rapid translocation of cytoplasmic ACE2 to the cell surface of CD14+ monocytes after TLR activation.
a Imaging flow cytometry analysis of cytoplasmic and surface ACE2 protein in CD14+ MO with or without R848 treatment up to 4 h. Each cell is represented by the row of images that include bright field (BF), DAPI (purple), CD14 (turquoise), ACE2 (red), and the overlapping image merged with DAPI, CD14, and ACE2. b Histograms of ACE2 intensity on the cell surface of CD14+ monocytes treated with R848 (left). Grey line represents the isotype control group (Iso). Column graphs indicate MFI of ACE2 surface intensity at other indicated conditions (right) (n = 3 biologically independent samples/group). c Representative confocal microscopy of ACE2 protein in CD14+ monocytes with or without R848 treatment for 24 h. Bars, 10 µm. Dashed lines show location of cell membrane. Images show cells from two healthy donors with similar results. d Immunoblot showing ACE2 and CD63 expression in exosomes isolated from plasma of healthy donors. The monkey kidney epithelial cell line Vero was used as a positive control. e Flow cytometry analysis of ACE2 surface expression in PBMCs pre-treated with the indicated concentrations of endosidin 2 (ES2) or DMSO for 1–2 h before ex vivo incubation with R484, LPS, or medium alone for 4 h. f Frequency of ACE2+ MO for data shown in e. Bars represent means ± SEM of biologically independent samples (n = 3/group for 40 µM ES2 condition; n = 4/group for all other conditions).

