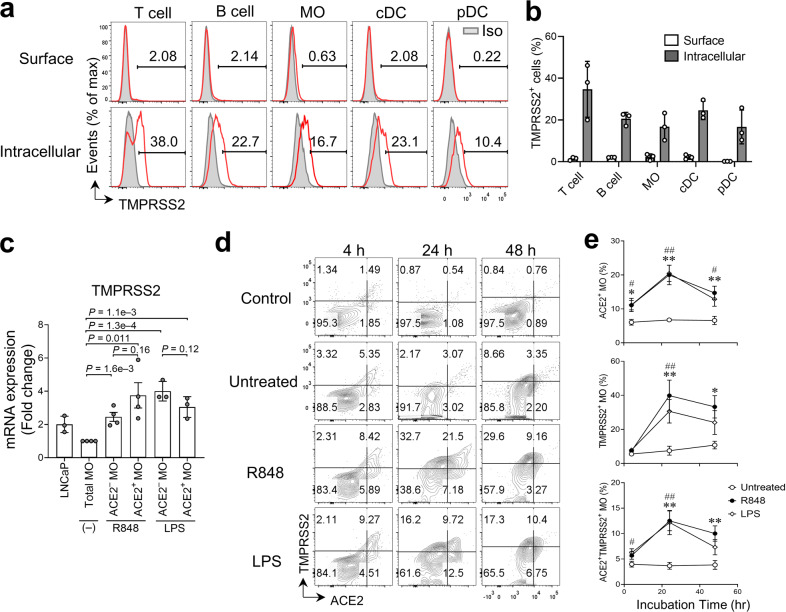
Fig. 3. Concurrent expression of ACE2 and TMPRSS2 on the cell surface of monocytes after TLR4/7/8 stimulation.
a Representative flow cytometric analysis of TMPRSS2 protein expression (red line) in T cells, B cells, CD14+ MO, cDCs, and pDCs from PBMCs isolated from healthy donors. Mouse IgG1 antibody (gray tinted) was used as isotype (Iso) control. b Frequency of cells with cell surface and cytoplasmic TMPRSS2 expression as in (a) (n = 3 biologically independent samples/group). c Relative TMPRSS2 mRNA expression in indicated cell types compared to expression in total MOs without treatment. (n = 3-4 biologically independent samples per group). A human prostate adenocarcinoma cell line LNCaP was used as the positive control. d Flow cytometry analysis of ACE2 and TMPRSS2 cell surface expression of CD14+ MO in PBMCs cultured ex vivo with R484, LPS, or medium alone (Untreated) for 4, 24, and 48 h. The expression levels of ACE2 and TMPRSS2 in B cells from the same donor served as the untreated baseline control (Control). e Frequency of ACE2+ MO, TMPRSS2+ MO, and ACE2+ TMPRSS2+ MO for each condition in d. Bars represent means ± SEM of biologically independent samples (n = 6/group at 4 h and 24 h; n = 5/group at 48 h). * indicates comparisons between R848-treated and untreated groups; # indicates comparison of LPS-treated and untreated groups. * or #, P < 0.05; ** or ##, P < 0.01.

