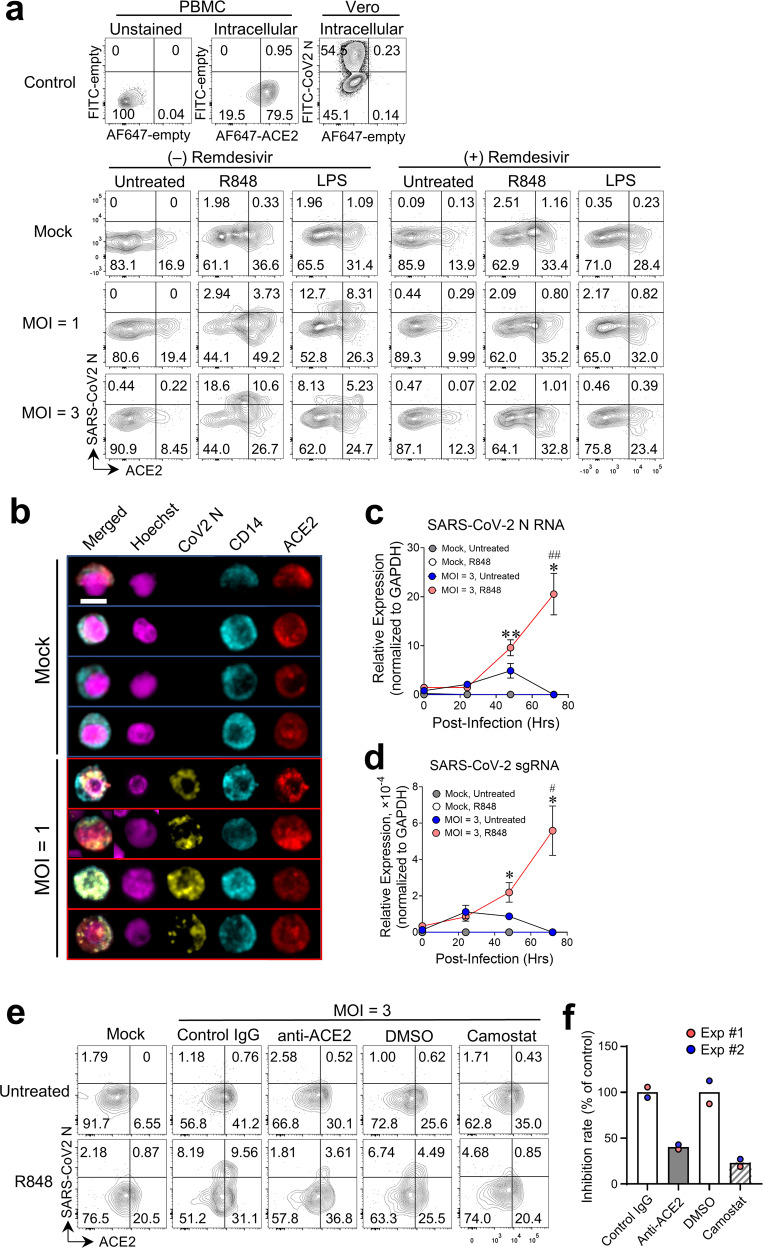
Fig. 4. Infection of ACE2+CD14+ monocytes by SARS-CoV-2 upon TLR4/7/8 activation.
a PBMCs were cultured with R848, LPS, or medium alone with or without 100 nM remdesivir for 2 h before infection. Pretreated cells were infected with SARS-CoV-2 (MOI = 1 or 3) or mock-infected for 24 h in the presence of stimuli and/or inhibitor. Flow cytometry analysis of CD14+ monocytes from mock-infected and SARS-CoV-2-infected cells showing cell surface ACE2 (Alexa Fluor 647-labeled antibody) and intracellular SARS-CoV-2 nucleocapsid (N) protein (FITC-labeled antibody). FACS channels with no staining are shown as “empty”. Data were collected pooled PBMCs from 3 healthy donors. Two independent infection experiments were performed with similar results. b Confocal fluorescence microscopy of R848-stimulated PBMCs infected with SARS-CoV-2 as in a and stained with Hoechst 33342 (nuclear stain) and fluorescent antibodies against SARS-CoV-2 N protein, CD14, and ACE2. Representative images of cells from mock and infected groups. Scale bar, 5 µm. c qRT-PCR of SARS-CoV-2 N RNA in PBMCs pretreated with R848 or medium alone for 2 h and infected with SARS-CoV-2 at MOI = 3 or mock-infected for an additional 2 h. Cells were washed then cultured with fresh medium (10% serum) for indicated time periods before RNA extraction. * indicates comparisons between 0 h and other time points for R848-treated groups with viral infections. # indicates comparison of R848-treated and untreated groups with viral infections at the same time points. * or #, P < 0.05; ** or ##, P < 0.01. d qRT-PCR of SARS-CoV-2 sgRNA in the cells as treated in c. e Flow cytometry of cell surface ACE2 and intracellular SARS-CoV-2 N protein in CD14+ monocytes from PBMCs cultured with R848 or medium alone with or without 2 µg/mL anti-ACE2 antibody or goat IgG control, 50 µM camostat mesylate, or 2% DMSO (vehicle) for 2 h and then infected with SARS-CoV-2 at MOI = 3 or mock-infected for 24 h in the presence of stimuli and/or antibody/inhibitor. f Percentage of ACE2+ CoV-2 N+ monocytes in antibody- or inhibitor-treated groups compared to control groups. Each dot represents pooled PBMCs from 3 healthy donors. Two independent infection experiments were performed with similar results.

