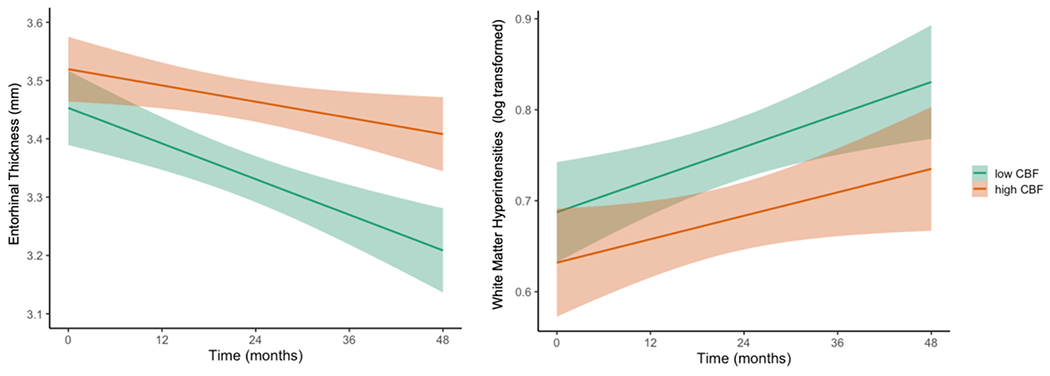
Figure 2.

Trajectories of entorhinal cortical thinning and WMH progression by baseline entorhinal CBF
Model-predicted values of entorhinal cortical thickness and white matter hyperintensity volume, adjusted for age, sex, APOE ε4 genotype, p-tau/Aβ positivity, and FDG-PET. For visual comparison, the graphs display results for low entorhinal cerebral blood flow (CBF) and high entorhinal CBF which were determined by a median split of the values in the analytic sample. Shaded area represents 95% confidence intervals. mm = millimeters
