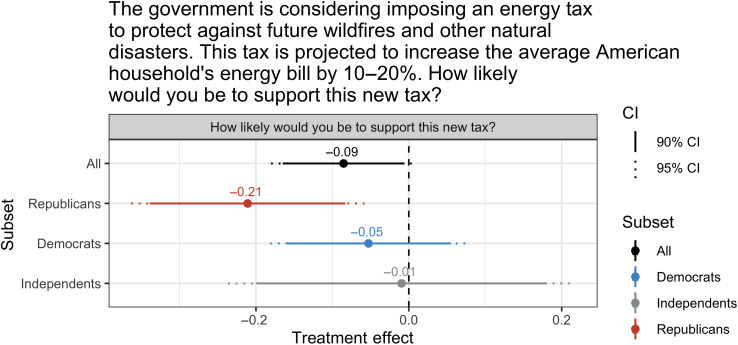
Fig. 4. Treatment effect on support for energy tax.
This figure presents the effect of our treatment on the full sample and by respondents’ party identification. The dependent variable is the respondent’s likelihood of supporting the tax. A value of 0 denotes “extremely unlikely,” while a value of 4 denotes “extremely likely.” All regressions use OLS and control for respondent’s gender, income, race, and level of education.

