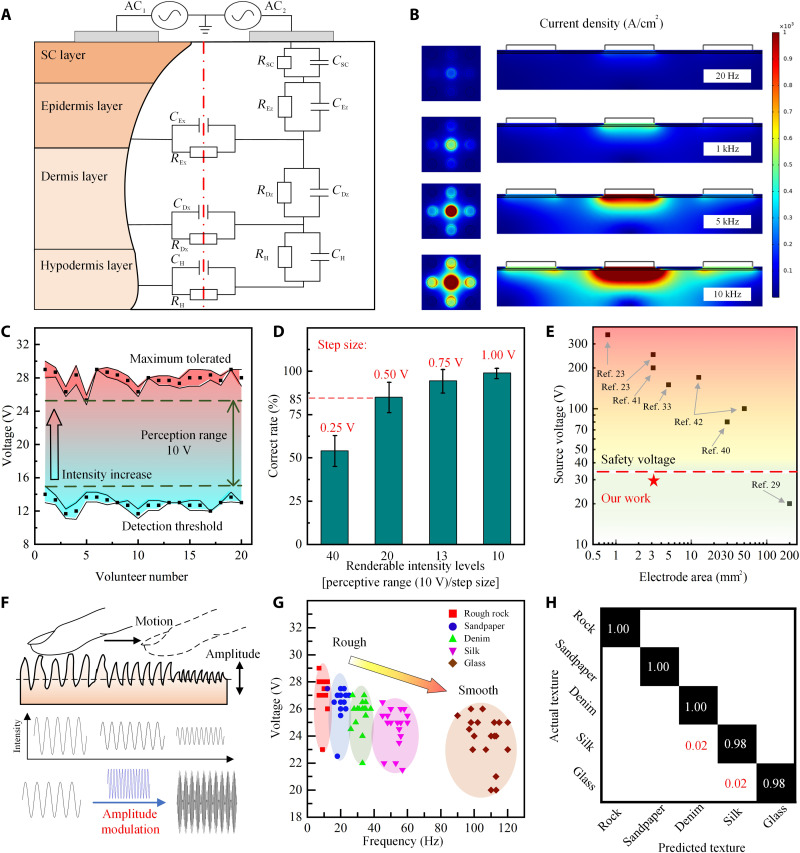
Fig. 2. The simulation and experimental results of electrical stimulation using high-frequency AC.
(A) Schematic illustration of electrical impedance model and equivalent circuit of the human skin. SC, stratum corneum. (B) Simulation results of current density distribution at different frequencies. (C) Relationship between tactile perception intensity and stimulation voltage; as the voltage increases, the intensity gradually increases from a slight touch to a sharp prick. Error bars indicate the fluctuation of the test results of each volunteer in multiple measurements. (D) Ability of the electrotactile system to render different tactile intensities. The number of renderable intensity levels can be changed by adjusting the step size of each changed voltage. Users can feel 20 different intensity levels with 85% accuracy. Error bars show the SD between 20 volunteers. (E) Comparison of the applied voltage and electrode areas in this work with other electrotactile devices. (F) Illustration of the roughness perception, which is mainly determined by intensity and vibration frequency. (G) Relationship between the roughness perception and stimulation voltage and frequency. (H) Classification confusion matrix of five different roughness surfaces.

