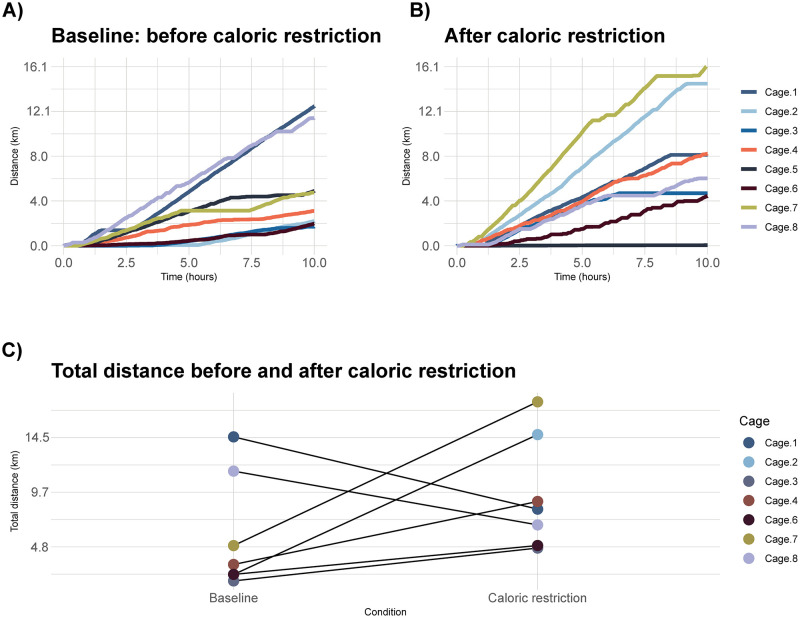
Fig 4.
A. Distance traveled overnight by each cage prior to caloric restriction. B. Distance traveled overnight by the same cages following three days of caloric restriction at 80% of the normal diet. C. Comparison of total distance before and after caloric restriction. When Cage 5 was removed from the analysis, the difference between baseline and caloric restriction was not found to be statistically significant (permutation test, p = 0.0876).

