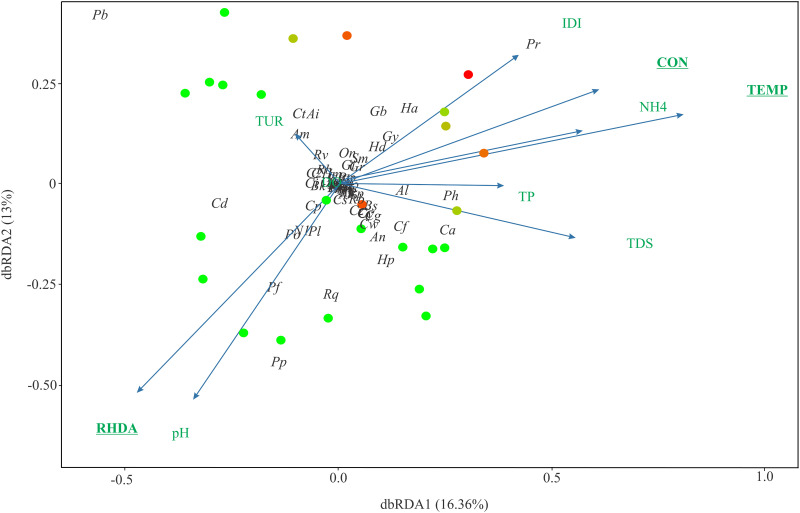
Fig 3. Distanced-based redundancy analyses (dbRDA) plots of species composition and the environmental variables for all streams.
The colors demonstrate the degree of urbanization (red), that is, when the point is red, it presents a high degree of urbanization. The arrows indicate how the variables are related to the dbRDA axes and the underlined variables were statistically significant. IDI- Integrated Disturbance Index, RHDA- Rapid Habitat Diversity Assessment, TDS- Total dissolved solids, TP- Total phosphorus, NH4- Ammonia, TPT- Temperature, CON- Conductivity, DO- Dissolved oxygen, TUR- turbidity. Am = Ancistrus mullerae; An = Ancistrus sp.; Al = Astyanax lacustris, Cd = Cambeva davisi; Cf = Cambeva aff. davisi; Ct = Cambeva stawiarski; Ca = Corydoras aeneus; Geophagus brasiliensis; Gy = Gymnotus sylvius Hp = Hisonotus pachysarkos; Ha = Hypostomus ancistroides; Hd = Hypostomus derbyi; N1 = Neoplecostomus sp. 1; Pb = Psalidodon bifasciatus; Po = Psalidodon bockmanni; Pf = Psalidodon aff. fasciatus; Pp = Psalidodon aff. paranae; Ph = Phalloceros harpagos; Pr = Poecilia reticulata. See S2 Table for the code for the other species.

