
Fig. 2.
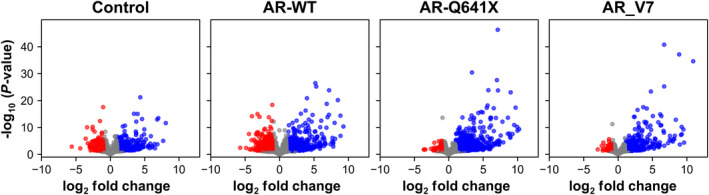
Distribution of RNA‐seq data. Volcano plot representing the distribution of RNA‐seq data of the four experimental conditions. Genes with adjusted P‐value < 0.05 and |log2FC| > 1 are shown in red (significantly downregulated genes) and blue (significantly upregulated genes). RNA‐seq was performed from three biological replicates.