
Fig. 5.
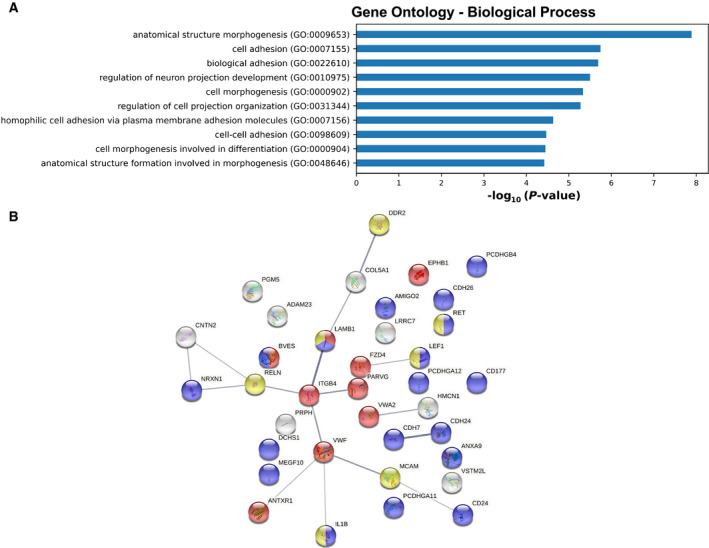
Gene Ontology enrichment analysis of 395 AR‐repressed genes. (A) Bar charts showing the Gene Ontology (GO) terms with a fold enrichment > 2 and P‐value < 0.05, for Biological Process (BP) following analysis of the 395 genes repressed by AR‐WT. (B) StringDB network analysis of the 36 genes identified in the ‘cell adhesion’ GO term. The edges indicate both functional and physical protein associations. Colors indicate the proteins related to the ‘cell–cell adhesion’ (blue), ‘cell‐substrate adhesion’ (red), and ‘positive regulation of cell migration’ (yellow) GO BP term.