
Fig. 6.
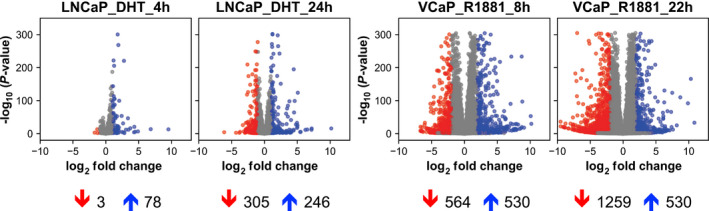
Analysis of repression activity by AR in GEO datasets GSE 125014 and GSE 148397. Volcano plot representing the distribution of GEO datasets with downregulated genes shown in red and upregulated genes shown in blue. (Left) GSE125014, thresholds P‐value < 0.05 and |log2FC| > 1. (Right) GSE148397, thresholds P‐value < 0.01 and |log2FC| > 2. Number of significantly regulated genes are indicated below the plots.