Fig. 7.

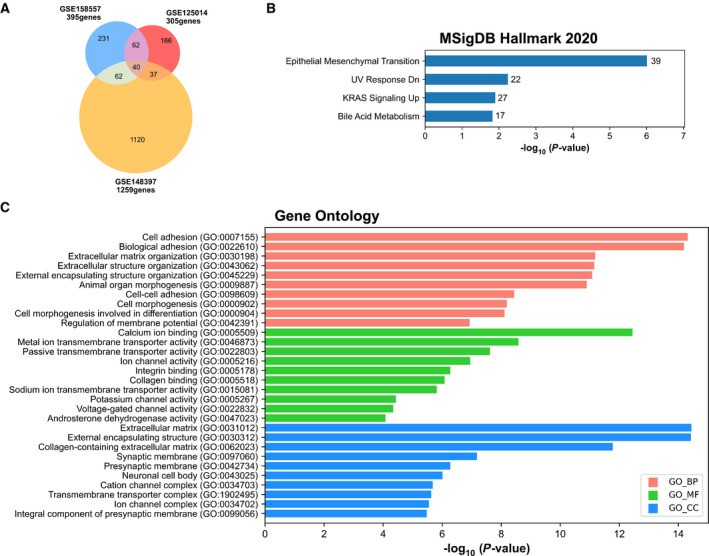
MSigDB Hallmark 2020 and Gene Ontology enrichment analysis of 1718 AR‐repressed genes. (A) Venn diagram representing the intersection of the genes significantly repressed in GSE158557, GSE125014, and GSE148397 data. Genes with adjusted P‐value < 0.05 and log2FC < −1 for GSE158557 and GSE125014 data, and adjusted P‐value < 0.01 and log2FC < −2 for GSE148397 data. (B) Bar charts showing all significant terms for MSigDB Hallmark 2020 ranked by P‐value following analysis of the 1718 repressed gene set. The number of the genes included in the identified pathways is plotted on the right of each bar. (C) Bar charts showing the top 10 Gene Ontology (GO) terms with a fold enrichment > 2 and P‐value < 0.05, for biological process (BP), molecular function (MF), and cellular component (CC), following analysis of the 1718 repressed gene set.
