. 2022 Aug 26;11:e80229. doi: 10.7554/eLife.80229

Figure 3. Analysis of the expanded-repeat CNBP alleles in dystrophy type 2 (DM2) patients.

Integrative Genomics Viewer (IGV) visualization (35-kbp windows) of ONT-targeted sequencing data from the expanded alleles of four representative DM2 patients. Complete reads were aligned at the 5′ end (A) and then at the 3′ end (B) in order to identify the repeat pattern that characterizes the expanded microsatellite locus. Each motif in the expanded alleles was visualized using a different color, as indicated in the key. Samples C and E contained a ‘pure’ CCTG expansion (blue) whereas samples A4 and A2 also contained the unexpected TCTG motif (red) downstream of CCTG. (C) Abundance of quadruplets identified in each patient. The y-axis shows the number of ONT reads with a certain number of repeats, whereas the x-axis shows the number of quadruplet repeats identified. ONT reads were grouped into 500 bp bins. The gray line represents the estimated kernel density of the underlying solid gray distribution of ONT reads.

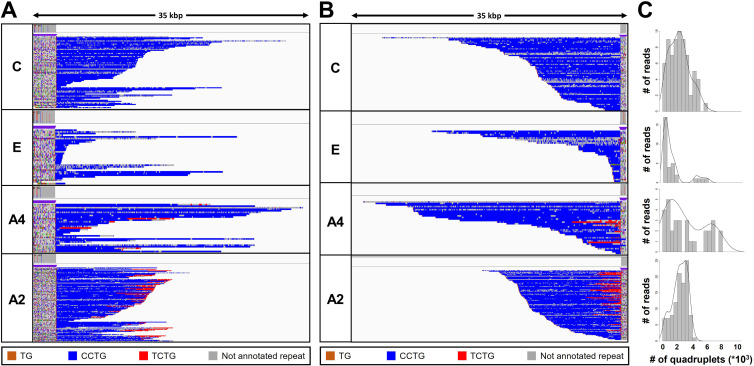
Figure 3.

Figure 3—figure supplement 1. Analysis of the CNBP repeat motif for the expanded alleles in dystrophy type 2 (DM2) patients.

Figure 3—figure supplement 1.

Integrative Genomics viewer (IGV) visualization (53-kbp window) of ONT-targeted sequencing data from the expanded alleles of the five remaining DM2 samples. Complete reads were aligned at the 5′ end (A) and subsequently at the 3′ end (B) in order to identify the repeat pattern characterizing the expanded microsatellite locus. Each motif in the expanded alleles was visualized using a different color, as indicated in the key. All samples feature the unexpected TCTG motif of variable length downstream of the CCTG motif. (C) Abundance of quadruplets identified in each patient. The y-axis shows the number of ONT reads with a certain number of repeats, whereas the x-axis shows the number of quadruplet repeats identified. ONT reads were grouped into 500 bp bins. The gray line represents the estimated kernel density of the underlying solid gray distribution of ONT reads. (D) IGV visualization of ONT-targeted sequencing data from the expanded alleles of two representative patients (E and A3) carrying a pure CCTG expansion and a repeat with the TCTG motif, respectively.
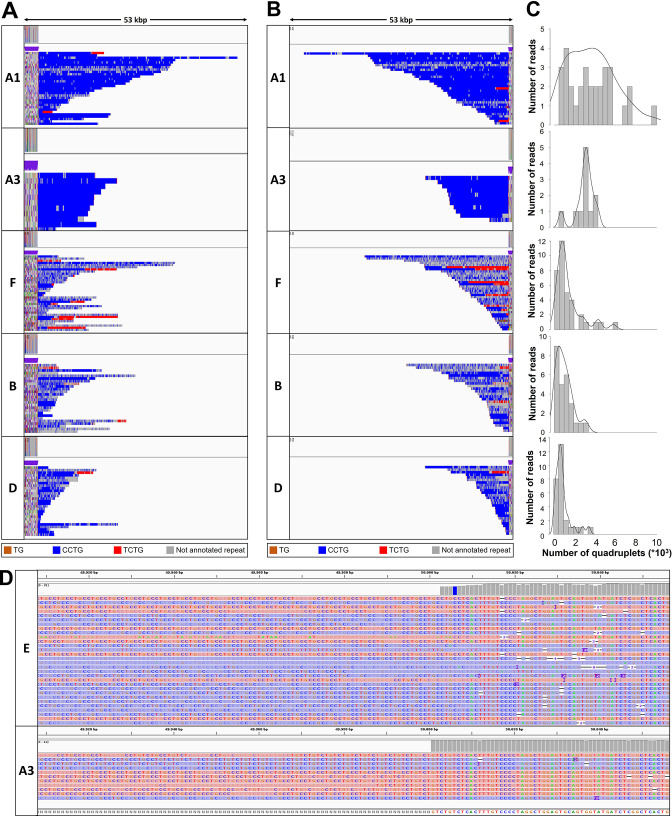
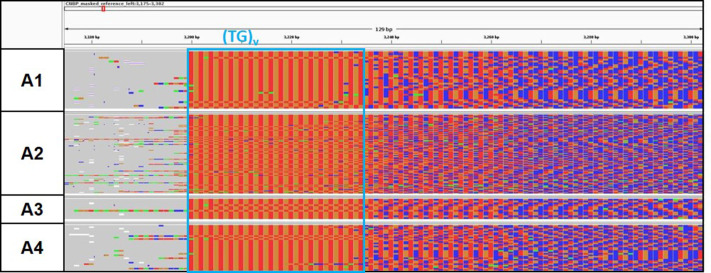
Figure 3—figure supplement 2. Analysis of the CNBP 5′-end (TG)v repeat motif of the CNBP expanded alleles of A1–A4 dystrophy type 2 (DM2) family members.

Figure 3—figure supplement 2.

Integrative Genomics viewer (IGV) visualization (~130 bp window) of ONT-targeted sequencing data from the expanded alleles of the DM2 family members. Complete reads were aligned at the 5′ end in order to identify the repeat pattern characterizing the expanded microsatellite locus. Nucleotides of the expanded repeat have been colored with A: green, C: blue, G: orange, and T: red.