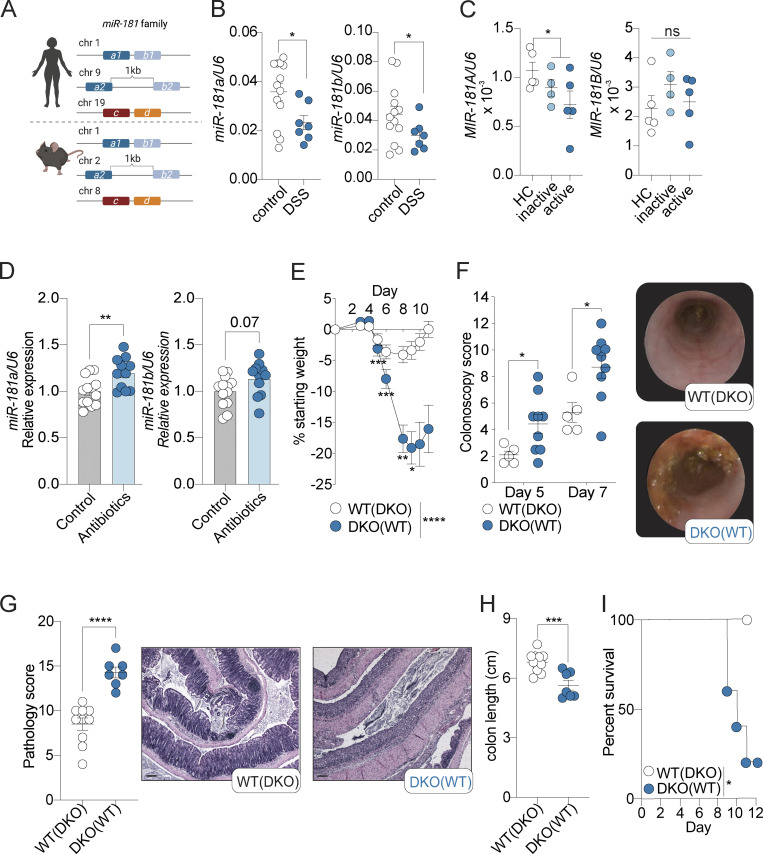
Figure 1.
miR-181 protects against DSS-induced colitis. (A) Schematic of the relative genomic locations of the three miR-181 clusters (miR-181a1-b1, miR-181a2-b2, and miR-181c-d) in humans (top) and mice (bottom). (B) Expression of mature miR-181a and miR-181b in colonic IECs from WT mice at baseline (n = 13) or after 6–7 d of DSS treatment followed by 4–7 d of recovery (n = 7) starting at 8 wk of age. Each dot represents a single mouse. Values normalized to U6 expression. Data pooled from two independent experiments. (C) Expression of mature MIR-181A and MIR-181B in colonic IECs from human patients with inactive or active UC or from healthy individuals (healthy controls [HC]). Each dot represents a single donor. Values normalized to U6 expression. (D) Expression of mature miR-181a and miR-181b in colonic IECs from WT mice after treatment with broad-spectrum antibiotics for 7 d starting at 8 wk of age (control n = 13, antibiotic-treated n = 11). Each dot represents a single mouse. Values normalized to U6 expression. Data pooled from three independent experiments and normalized to miR-181 levels in control samples. Discrete P value shown for unpaired t test of miR-181b data (P = 0.07). (E) Mean percent change in weight from day 0 of cohoused WT (n = 22) and miR-181 DKO (n = 17) mice treated with 2% DSS starting at 6–8 wk of age. DSS was withdrawn from all animals when DKO mice reached 7.5–10% weight loss. Data pooled from four independent experiments. Parentheses indicate cohousing with specified group of mice. (F) Colonoscopy scores and representative colonoscopy images of cohoused WT (n = 5) and DKO (n = 9) mice assessed after 5 and 7 d of treatment with 2% DSS starting at 6–8 wk of age. Each dot represents a single mouse. Parentheses indicate cohousing with specified group of mice. (G) Pathology scores and representative H&E images of longitudinally sectioned colon rolls (rolled distal to proximal) from WT and DKO mice treated with 2% DSS starting at 6–8 wk of age. DSS was withdrawn from all animals when DKO mice reached 7.5–10% weight loss and allowed to recover for 3–4 d. Each dot represents a single animal. Data pooled from two independent experiments. Parentheses indicate cohousing with specified group of mice. Scale bars correspond to 0.1 mm. (H) Colon length of WT (n = 11) and DKO (n = 7) mice treated with 2% DSS. DSS was withdrawn from all animals when DKO mice reached 7.5–10% weight loss. Each dot represents a single animal. Data pooled from two independent experiments. Parentheses indicate cohousing with specified group of mice. (I) Percent survival of WT (n = 5) and DKO (n = 5) treated with 2% DSS for 6 d and allowed to recover for 6 d. Data representative of six independent experiments. Parentheses indicate cohousing with specified group of mice. Error bars indicate mean ± SEM. Unpaired Student’s t test (B–D, G, and H), multiple t tests with FDR correction (F), Kruskal–Wallis test with Dunn’s multiple comparisons (E), or Mantel–Cox log-rank test (I); *, P < 0.05; **, P < 0.01; ***, P < 0.001; ****, P < 0.0001. Significance values for paired genotype comparisons from multivariate analyses are indicated with a vertical bar and appropriate P- or q-value (represented by asterisk) when appropriate. Significance values for multiple comparisons tests assessing day-to-day changes in weight loss between groups are indicated by P values next to individual data points if <0.05.

