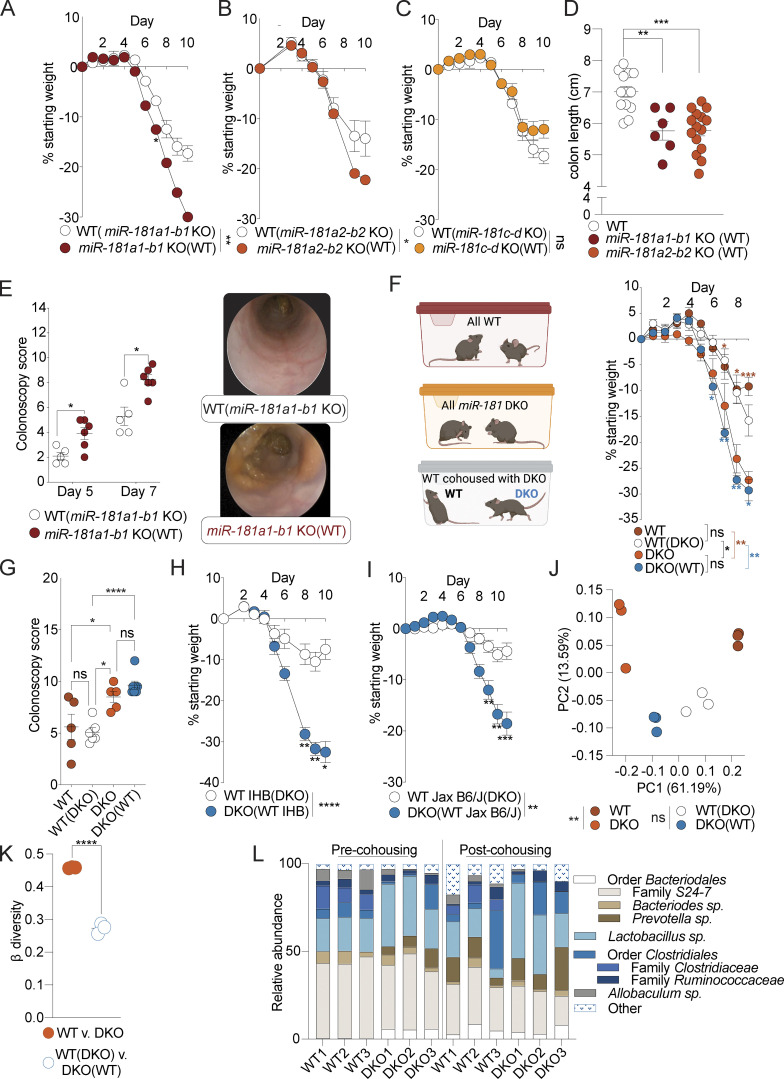
Figure 2.
Multiple miR-181 loci are sufficient to protect against colitis. (A) Mean percent change in weight from day 0 of cohoused WT (n = 3) and miR-181a1-b1 KO mice (n = 6) treated with 2% DSS starting at 6–8 wk of age. DSS was withdrawn at day 6, and animals were allowed to recover for 4 d. Data from one experiment. Parentheses indicate cohousing with specified group of mice. (B) Mean percent change in weight from day 0 of cohoused WT (n = 19) and miR-181a2-b2 KO mice (n = 28) treated with 2% DSS starting at 6–8 wk of age. DSS was withdrawn at day 7, and animals were allowed to recover for 3 d. Data pooled from two independent experiments. Parentheses indicate cohousing with specified group of mice. (C) Mean percent change in weight from day 0 of cohoused WT (n = 3) and miR-181c-d KO mice (n = 6) treated with 2% DSS starting at 6–8 wk of age. DSS was withdrawn at day 6, and animals were allowed to recover for 4 d. Parentheses indicate cohousing with specified group of mice. (D) Colon length of WT (n = 13), miR-181a1-b1 KO (n = 6), and miR-181a2-b2 KO (n = 15) mice treated with 2% DSS starting at 6–8 wk of age. DSS was withdrawn at day 7, and animals were allowed to recover for 3 d. Parentheses indicate cohousing with specified group of mice. Each dot represents a single animal. Data from one to two independent experiments. (E) Colonoscopy scores and representative colonoscopy images of cohoused WT B6/J (n = 5) and miR-181a1-b1 KO (n = 6) mice assessed after 5 and 7 d of treatment with 2% DSS starting at 6–8 wk of age. Each dot represents an individual animal. (F and G) Mean percent change in weight from day 0 (F) and terminal colonoscopy scores (G) of cohoused WT (n = 5) and DKO mice (n = 7) and noncohoused WT (n = 5) and DKO mice (n = 5) treated with 2% DSS starting at 6–8 wk of age. DSS was withdrawn at day 6, and animals were allowed to recover. Group comparisons are indicated by colored asterisks and brackets (red = WT vs. DKO, blue = WT[DKO] vs. DKO[WT]). Experimental set up is illustrated for clarity (F). For colonoscopy scores, each dot represents an individual animal. Parentheses indicate cohousing with specified group of mice. (H) Mean percent change in weight from day 0 of IHB WT mice cohoused with DKO mice and treated with 2% DSS starting at 6–8 wk of age. DSS was withdrawn at day 6, and animals were allowed to recover for 4 d. Data representative of six independent experiments. Parentheses indicate cohousing with specified group of mice. (I) Mean percent change in weight from day 0 of WT mice from Jax cohoused with DKO mice and treated with 2% DSS starting at 6–8 wk of age. DSS was withdrawn from all animals when DKO mice reached 7.5–10% weight loss. Data pooled from three independent experiments. Parentheses indicate cohousing with specified group of mice. (J and K) PCA (J) and β diversity (K) analysis of fecal microbial communities as determined by 16s rRNA-seq of stool from WT (n = 3) and DKO mice (n = 3) pre- and post-cohousing. Each dot represents an individual animal at a given condition (J) or discrete grouped comparisons (K). PERMANOVA statistics reported for PCA for grouped comparisons (J). Data representative of two independent experiments. Parentheses indicate cohousing with specified group of mice. (L) Individual mouse fecal microbiota composition at the genus level as determined by 16s rRNA-seq of stool from WT (n = 3) and DKO mice (n = 3) pre- and post-cohousing. The most-resolved taxonomic information is indicated. Nested taxonomic categories indicate related groups. Data representative of two independent experiments. Error bars indicate mean ± SEM. Two-way ANOVA with Sidak’s multiple comparisons test (A–C, F, H, and I), multiple t tests with FDR correction (D, E, and G), PERMANOVA (J), or unpaired Student’s t test (K). *, P < 0.05; **, P < 0.01; ***, P < 0.001; ****, P < 0.0001. Significance values for paired genotype comparisons from multivariate analyses are indicated with a vertical bar and appropriate P- or q-value (represented by asterisk) when appropriate. Significance values for multiple comparisons tests assessing day-to-day changes in weight loss between groups are indicated by P values next to individual data points if <0.05.

