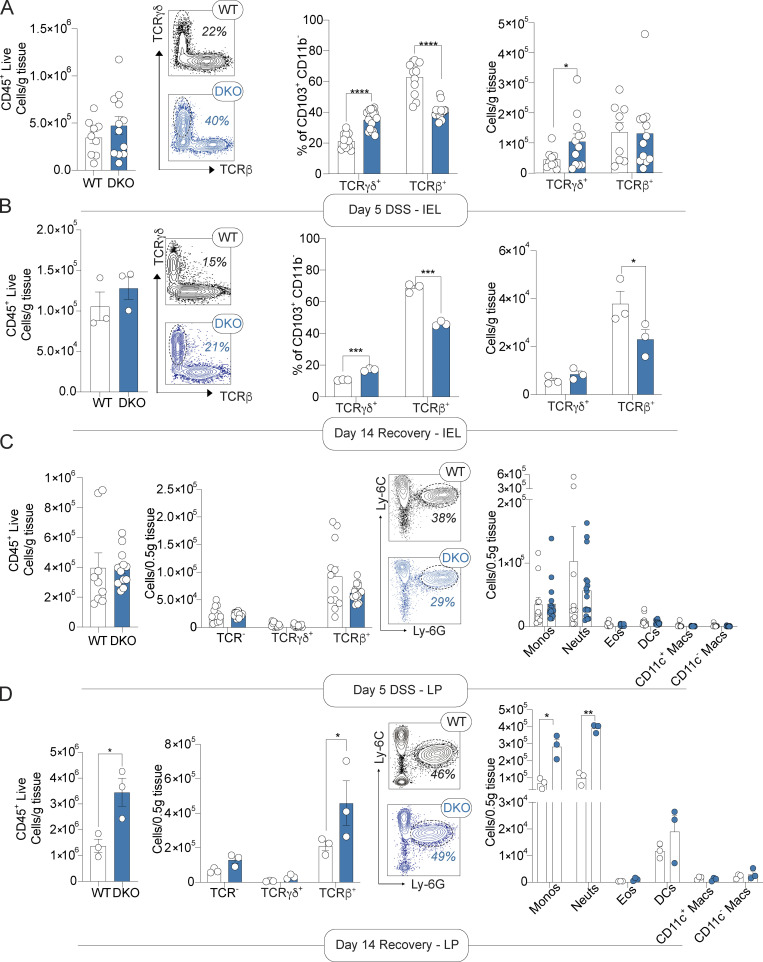
Figure 3.
miR-181 protects against chronic inflammation in response to mucosal injury. (A and B) Large IELs after 5 d of (A) and recovery from (B) DSS treatment. From left to right, total number of CD45+ live cells, representative FACS plots of WT and DKO mouse IELs showing distribution of TCRγδ and TCRβ populations with percentage of TCRγδ IELs in each, and percentage and total number of TCRγδ+ and TCRβ+ IELs from WT and DKO mice. Each dot represents an individual mouse. (C and D) Large intestine LP immune cells after 5 d of (C) and recovery from (D) DSS treatment. From left to right, total number of CD45+ live cells, total number of TCRγδ+ and TCRβ+ LPLs from WT and DKO mice, representative FACS plots of WT and DKO mouse LPMs showing distribution of Ly-6C and Ly-6G populations with percentage of neutrophils in each, and total number of LP monocytes (Ly-6C+ Ly-6G−, monos), neutrophils (Ly-6C− Ly-6G+, neuts), eosinophils (Ly-6C− Ly-6G− Siglec-F+, SSC-Ahi, eos), CD11b+ dendritic cells (Ly-6C− Ly-6G− Siglec-F− MHCII+ CD11c+ CD64−, DCs), and macrophages (Ly-6C− Ly-6G− Siglec-F− MHCII+ CD11c+/− CD64+, macs) in WT and DKO mice. Each dot represents an individual mouse. For early DSS analysis, data are pooled from two independent experiments with a total of n = 8–9 WT and n = 12 DKO mice. Data collected from mice during recovery from DSS (7 d of DSS treatment, 7 d of recovery) were from one experiment with a total of n = 3 WT and n = 3 DKO animals. Error bars indicate mean ± SEM. Unpaired t test (CD45+ live quantification), multiple t tests with FDR correction (A–D). *, P < 0.05; **, P < 0.01; ***, P < 0.001; ****, P < 0.0001.

