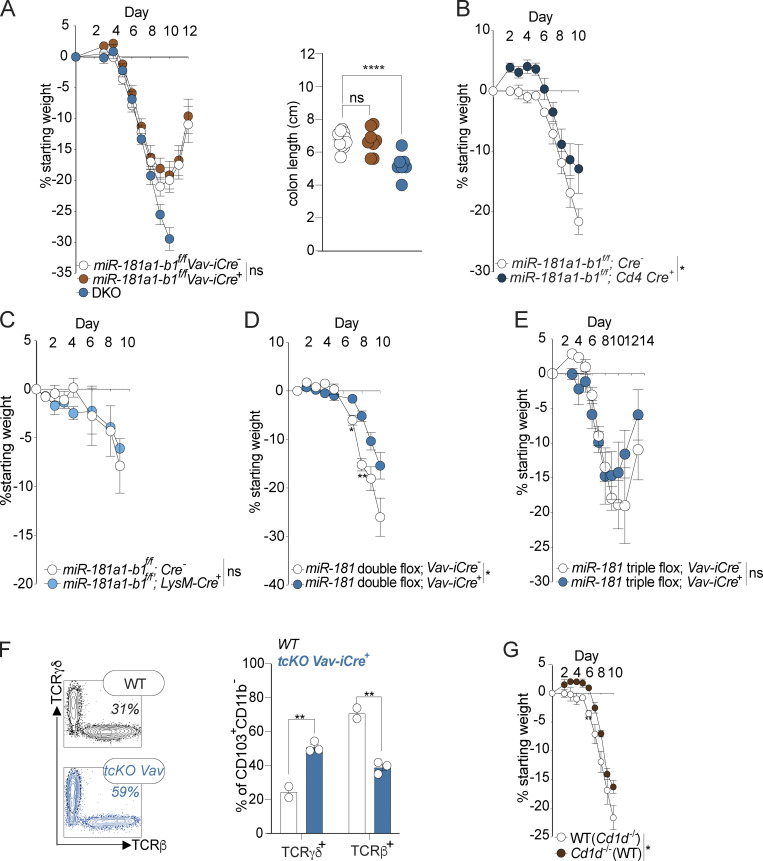
Figure 4.
miR-181 does not act within the hematopoietic system to protect against severe colitis. (A) Mean percent change in weight from day 0 and colon length of miR-181a1-b1f/f; Vav-iCre− (n = 17), miR-181a1-b1f/f; Vav-iCre+ (n = 11), and DKO mice (n = 10) treated with 2% DSS starting at 6–8 wk of age. DSS was withdrawn at day 7 and animals were allowed to recover for 5 d. For colon length data, each dot represents an individual mouse. Data are representative of two independent experiments. (B) Mean percent change in weight from day 0 miR-181a1-b1f/f; Cd4-Cre− (n = 5) and miR-181a1-b1f/f; Cd4-Cre+ (n = 3) mice treated with 2% DSS starting at 6–8 wk of age. DSS was withdrawn at day 7, and animals were allowed to recover for 3 d. Data representative of two independent experiments. (C) Mean percent change in weight from day 0 of miR-181a1-b1f/f; LysM-Cre− (n = 3) and miR-181a1-b1f/f; LysM-Cre+ (n = 3) mice treated with 2% DSS starting at 6–8 wk of age. DSS was withdrawn at day 8, and animals were allowed to recover. Data representative of two independent experiments. (D) Mean percent change in weight from day 0 of miR-181a1-b1f/f; miR-181a2-b2f/f; Vav-iCre− (n = 4) and miR-181a1-b1f/f; miR-181a2-b2f/f; Vav-iCre+ (n = 6) mice treated with 2% DSS starting at 6–8 wk of age. DSS was withdrawn at day 7, and animals were allowed to recover. Data pooled from two independent experiments. (E) Mean percent change in weight from day 0 of miR-181a1-b1f/f; miR-181a2-b2f/f; miR-181c-df/f; Vav-iCre− (n = 3) and miR-181a1-b1f/f; miR-181a2-b2f/f; miR-181c-df/f; Vav-iCre+ (n = 4) mice treated with 2% DSS starting at 6–8 wk of age. DSS was withdrawn at day 7, and animals were allowed to recover. (F) Percentage (left) and representative FACS plots (right) of TCRγδ+ and TCRβ+ IELs from 6–8-wk-old miR-181a1-b1f/f; miR-181a2-b2f/f; miR-181c-df/f; Vav-iCre− (WT) and miR-181a1-b1f/f; miR-181a2-b2f/f; miR-181c-df/f; Vav iCre+ mice (tcKO Vav-iCre+) after a 7-d treatment with 2% DSS followed by 1 wk of recovery. Each data point represents an individual mouse. Gated on: Singlets CD45+ Live (viability−) CD103+ CD11b− cells. Data representative of two independent experiments. (G) Mean percent change in weight from day 0 WT (n = 5) and Cd1d−/− (n = 3) mice treated with 2% DSS starting at 6–8 wk of age. DSS was withdrawn at day 8, and animals were allowed to recover. Error bars indicate mean ± SEM. Two-way ANOVA with Sidak’s multiple comparisons test (A–E and G), multiple Kruskal–Wallis tests with FDR correction (A and F). *, P < 0.05; **, P < 0.01; ****, P < 0.0001. Significance values for genotype comparisons are indicated with a vertical bar and appropriate P value represented by asterisk. Significance values for paired genotype comparisons from multivariate analyses are indicated with a vertical bar and appropriate P- or q-value (represented by asterisk) when appropriate. Significance values for multiple comparisons tests assessing day-to-day changes in weight loss between groups are indicated by P values next to individual data points if <0.05.

