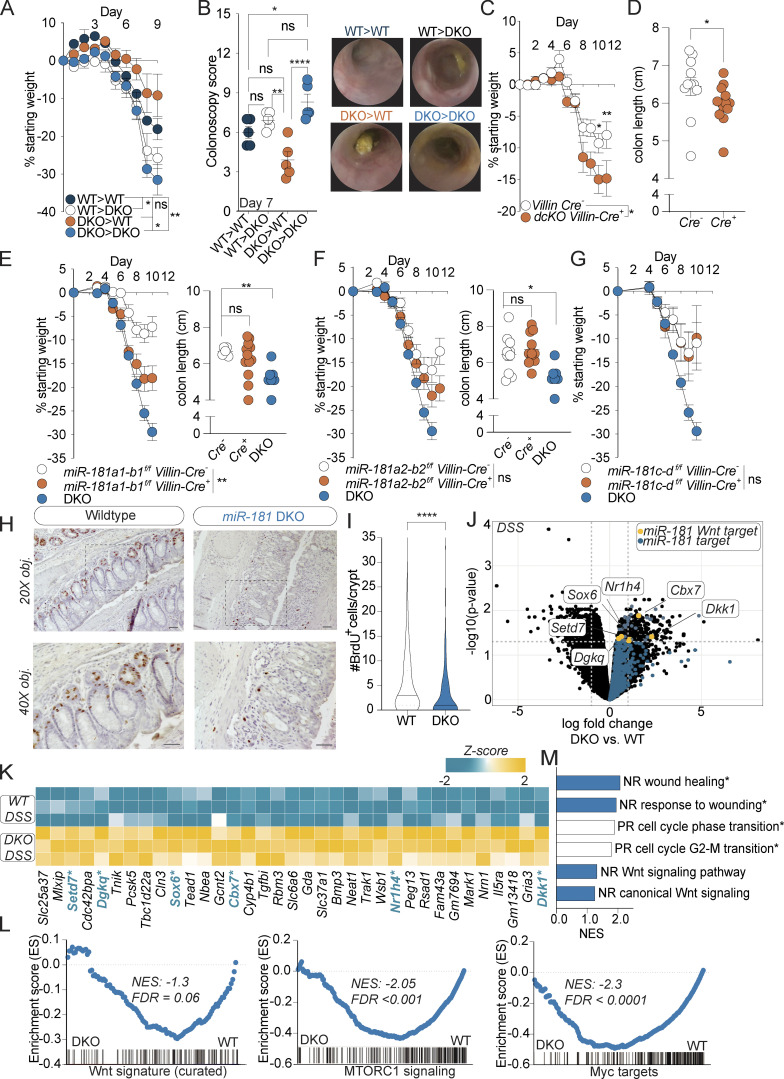
Figure 5.
miR-181 acts within IECs to protect against colitis. (A and B) Mean percent change in weight from day 0 (A) and colonoscopy scores (B) of WT and DKO BM chimeric mice treated with 2% DSS starting at 6–8 wk of age. DSS was withdrawn at day 7, and colonoscopy was performed. Animals were thereafter allowed to recover. For colonoscopy data, each dot represents an individual mouse. Representative colonoscopy images are shown on the right. (C and D) Mean percent change in weight from day 0 (C) and colon length (D) of miR-181a1-b1f/f; miR-181a2-b2f/f; Villin-Cre− (n = 12) and miR-181a1-b1f/f; miR-181a2-b2f/f; Villin-Cre+ (n = 15) mice treated with 2% DSS starting at 6–8 wk of age. DSS was withdrawn from all animals when DKO mice reached 7.5–10% weight loss. For colon length data, each dot represents an individual mouse. Data pooled from three independent experiments. (E) Mean percent change in weight from day 0 and colon length of miR-181a1-b1f/f; Villin-Cre− (n = 6), miR-181a1-b1f/f; Villin-Cre+ (n = 13), and DKO (n = 10) mice treated with 2% DSS starting at 6–8 wk of age. DSS was withdrawn at day 7, and animals were allowed to recover. For colon length data, each dot represents an individual mouse. Data representative of two independent experiments. (F) Mean percent change in weight from day 0 and colon length of miR-181a2-b2f/f; Villin-Cre− (n = 16), miR-181a2-b2f/f; Villin-Cre+ (n = 12), and DKO (n = 10) mice treated with 2% DSS starting at 6–8 wk of age. DSS was withdrawn at day 7, and animals were allowed to recover. For colon length data, each dot represents an individual mouse. Data representative of two independent experiments. (G) Mean percent change in weight from day 0 of miR-181c-df/f; Villin-Cre− (n = 6), miR-181c-df/f; Villin-Cre+ (n = 5), and DKO (n = 10) mice treated with 2% DSS starting at 6–8 wk of age. DSS was withdrawn at day 7, and animals were allowed to recover. Data representative of two independent experiments. (H and I) Representative images and quantification of the number of BrdU+ cells per colonic crypt (50 crypts counted per mouse) in WT and DKO mice after 8 d of 2% DSS administration and 4 d of recovery. Mice were then injected intraperitoneally with 100 mg/g of body weight of BrdU and sacrificed 4 h after injection for histology with representative images shown. Data pooled from two independent experiments. Median values indicated by horizontal bar. Scale bars in H indicate 0.1 mm. (J) Volcano plot of genes expressed in colonic IECs from WT (n = 3) and DKO (n = 3) mice treated with DSS for 7 d and allowed to recover for 2 d. All miR-181 targets increased in DKO mice are highlighted in blue with specific negative regulators of the Wnt pathway highlighted in yellow. (K) Heat map of all significantly enriched miR-181 target genes (n = 35) in IECs from DSS-treated DKO mice relative to WT. Negative regulators of the Wnt pathway (n = 6) are highlighted in blue and indicated by asterisk. (L) GSEA of RNA-seq data (TMM-normalized log2-transformed gene counts per million) from colonic IECs derived from WT and DKO mice treated with DSS for 7 d and allowed to recover for 2 d. Shown are the GSEA plots for a curated Wnt signature from Van der Flier et al. (2007), and hallmark pathways mTORC1 and Myc targets (V1). Normalized enrichment scores (NES) and FDR values are included. (M) Gene ontology pathways as assessed by GSEA that were enriched in colonic IECs from DSS-treated WT (white bars) or DKO (blue bars) mice. Significant pathways (FDR < 0.01) indicated by asterisk. NR, negative regulation; PR, positive regulation. For E–G, representative experiments were performed at the same time and the same noncohoused DKO mice (n = 10) were used as positive controls for these experiments. Error bars indicate mean ± SEM. Two-way ANOVA with Sidak’s multiple comparisons test (A, C, and E–G), multiple t tests with false discovery rate correction (B and D–F), Kolmogorov–Smirnov test (I). *, P < 0.05; **, P < 0.01; ****, P < 0.0001. Significance values for paired genotype comparisons from multivariate analyses are indicated with a vertical bar and appropriate P- or q-value (represented by asterisk) when appropriate. Significance values for multiple comparisons tests assessing day-to-day changes in weight loss between groups are indicated by P values next to individual data points if <0.05.

