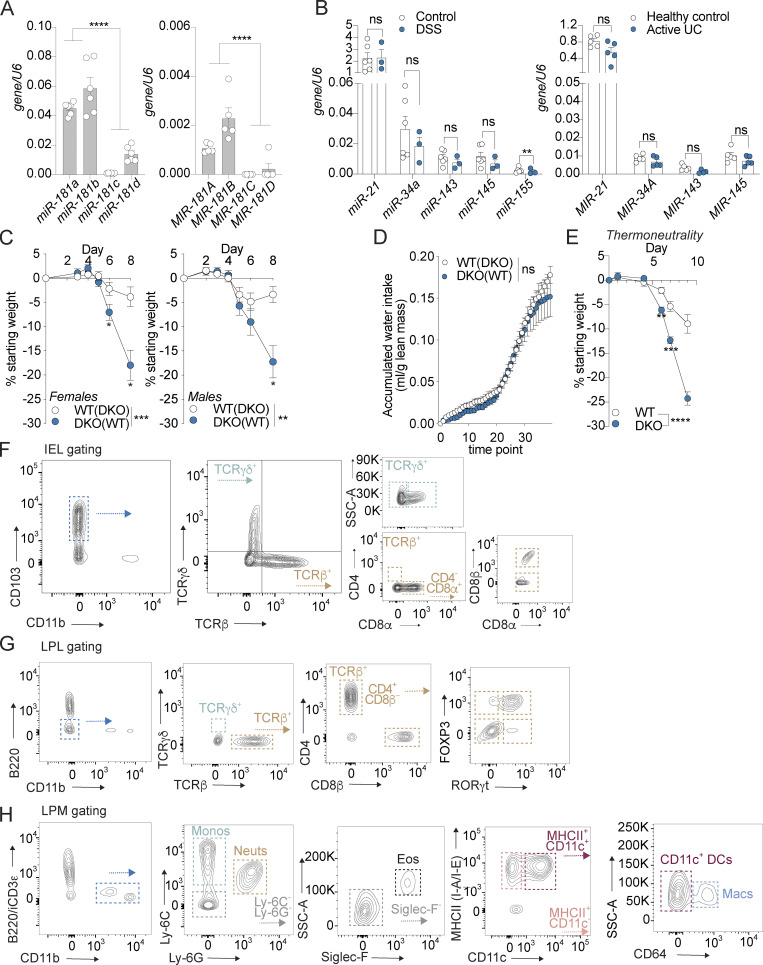
Figure S1.
miR-181 is expressed throughout the GI tract and protects against colitis independently of sex and temperature. (A) Expression of mature miR-181a, miR-181b, miR-181c, and miR-181d in colonic IECs from adult WT male mice (left) or human individuals (right) normalized to U6 expression. Each dot represents a single mouse or human. Mouse data representative of two independent experiments. (B) Levels of candidate miRNAs shown to be critical for maintaining intestinal homeostasis (miR-21, miR-34a, miR-143, miR-145, and miR-155) in mice (left) and humans (right) with colitis and healthy controls. Each dot represents a single mouse or human. (C) Mean percent change in weight from day 0 of cohoused WT IHB and DKO female (WT n = 11, DKO n = 9) and male (WT n = 11, DKO n = 8) mice treated with 2% DSS starting at 6–8 wk of age. DSS was withdrawn from all animals when DKO mice reached 7.5–10% weight loss. Data pooled from four independent experiments. (D) Evaluation of accumulated water consumption of WT and DKO mice by Comprehensive Laboratory Animal Monitoring System for 48 h (12-h light/dark cycles). Each dot represents grouped averages for the indicated timepoints. (E) Mean percent change in weight from day 0 of WT IHB (n = 14) and DKO (n = 9) male mice acclimated to thermoneutrality for 3 d and then treated with 2% DSS starting at 6–8 wk of age. DSS was withdrawn from all animals when DKO mice reached 7.5–10% weight loss. (F) IEL gating strategy. IELs were defined as CD45+ live CD103+ CD11b− cells isolated from the epithelial fraction of the large intestine. Subpopulations of IELs were categorized based on expression of TCRγδ and TCRβ. Further subcategorization of TCRγδ IELs was assessed based on expression of CD8α, while for TCRβ+ IELs, expression of CD4 and CD8α was then assessed. CD8β+ cells were quantified within the TCRβ+ CD8α+ population. (G) LPL gating strategy. LPLs were defined as CD45+ live (viability−) B220− CD11b− cells isolated from the LP of the large intestine. Subpopulations of LPLs were categorized based on expression of TCRγδ and TCRβ. Further subcategorization of TCRβ+ LPLs was assessed based on expression of CD4 and CD8β. CD4+ cells were further categorized based on expression of FOXP3 and RORγt. (H) LPM gating strategy. LPMs were defined as CD45+ live (viability−) B220− intracellular CD3ε− CD11b+ cells isolated from the LP of the large intestine. Subpopulations of LPMs were categorized as follows: monocytes (Ly-6C+ Ly-6G−, monos), neutrophils (Ly-6C− Ly-6G+, neuts), eosinophils (Ly-6C− Ly-6G− Siglec-F+ SSC-Ahi, eos), CD11b+ dendritic cells (Ly-6C− Ly-6G− Siglec-F− MHCII+ CD11c+ CD64−, DCs), and macrophages (Ly-6C− Ly-6G− Siglec-F− MHCII+ CD11c+/− CD64+, macs). Error bars indicate mean ± SEM. Student’s unpaired t test (A), multiple t tests with FDR correction (B), and two-way ANOVA with Sidak’s multiple comparisons test (C–E). *, P < 0.05; **, P < 0.01; ***, P < 0.001; ****, P < 0.0001. Significance values for paired genotype comparisons from multivariate analyses are indicated with a vertical bar and appropriate P- or q-value (represented by asterisk) when appropriate. Significance values for multiple comparisons tests assessing day-to-day changes in weight loss between groups are indicated by P values next to individual data points if <0.05.

