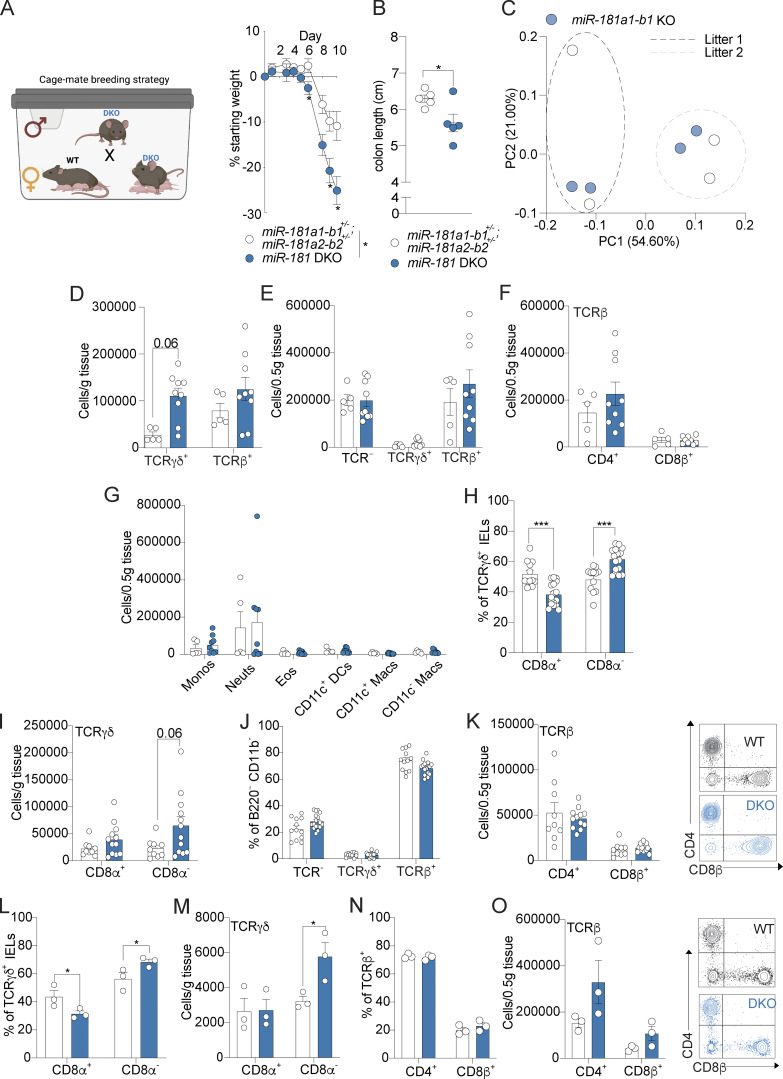
Figure S2.
miR-181 regulates the IEL milieu at homeostasis. (A and B) Mean percent change in weight from day 0 (A) and colon length (B) of cage-mate miR-181a1-b1+/−; miR-181a2-b2+/− (n = 5) and DKO mice (n = 12) treated with 2% DSS starting at 6–8 wk of age. DSS was withdrawn at day 8, and animals were allowed to recover for 2 d. Breeding strategy is illustrated for clarity (A). For colon length (B), each dot represents a single animal. (C) PCA of fecal microbial communities as determined by 16s rRNA-seq of stool from WT (n = 2 per litter) and miR-181a1-b1 KO littermates (n = 2 per litter) from two separate litters. Each dot represents an individual animal. (D) Total number of TCRγδ+ and TCRβ+ large intestinal IELs from WT and DKO mice at baseline. Each dot represents an individual mouse. Gated on: Singlets CD45+ Live (viability−) CD103+ CD11b− cells. Data pooled from two (WT n = 5, DKO n = 9) independent experiments. (E) Total number of TCR-, TCRγδ+, and TCRβ+ large intestinal LP cells from WT and DKO mice at baseline. Each dot represents an individual mouse. Gated on: Singlets CD45+ Live (viability−) B220− CD11b− cells. Data pooled from two (WT n = 5, DKO n = 9) independent experiments. (F) Total number of TCRβ+ CD4+/− CD8β+/− large intestinal LP cells from WT and DKO mice at baseline. Each dot represents an individual mouse. Gated on: Singlets CD45+ Live (viability−) B220− CD11b− TCRβ+ LP cells. Data pooled from two (WT n = 5, DKO n = 9) independent experiments. (G) Total number of large intestinal LPMs: monocytes (Ly-6C+ Ly-6G−, monos), neutrophils (Ly-6C− Ly-6G+, neuts), eosinophils (Ly-6C− Ly-6G− Siglec-F+ SSC-Ahi, eos), CD11b+ dendritic cells (Ly-6C− Ly-6G− Siglec-F- MHCII+ CD64− CD11c+, DCs), and macrophages (Ly-6C− Ly-6G− Siglec-F− MHCII+ CD11c+/− CD64+, macs) in WT and DKO mice at baseline. Gated on: Singlets CD45+ Live (viability−) B220− intracellular CD3ε− CD11b+ cells. Each dot represents a single mouse. Data pooled from two (WT n = 5, DKO n = 9) independent experiments. (H and I) Percentage (H) and total number (I) of TCRγδ+ large intestinal IELs expressing CD8α from WT (n = 8–9) and DKO (n = 12) mice after 5 d of 2% DSS treatment. Each dot represents an individual mouse. Gated on: Singlets CD45+ Live CD103+ CD11b− TCRγδ+ cells. Data pooled from two independent experiments. (J) Percentage of TCR−, TCRγδ+, and TCRβ+ large intestinal LPLs from WT (n = 8–9) and DKO (n = 12) mice after 5 d of 2% DSS treatment. Each dot represents an individual mouse. Gated on: Singlets CD45+ Live CD103+ CD11b− cells. Data pooled from two independent experiments. (K) Total number of TCRβ+ large intestinal LPLs expressing CD4 and CD8β from WT (n = 8–9) and DKO (n = 12) mice after 5 d of 2% DSS treatment. Each dot represents an individual mouse. Gated on: Singlets CD45+ Live CD103+ CD11b− TCRβ+ cells. Representative FACS plot shown on the right. Data pooled from two independent experiments. (L and M) Percentage (L) and total number (M) of TCRγδ+ large intestinal IELs expressing CD8α from WT (n = 3) and DKO (n = 3) mice after 7 d of 2% DSS treatment and 7 d of recovery. Each dot represents an individual mouse. Gated on: Singlets CD45+ Live CD103+ CD11b− TCRγδ+ cells. (N) Percentage of TCR−, TCRγδ+, and TCRβ+ large intestinal LPLs from WT (n = 3) and DKO (n = 3) mice after 7 d of 2% DSS treatment and 7 d of recovery. Each dot represents an individual mouse. Gated on: Singlets CD45+ Live CD103+ CD11b− cells. (O) Total number of TCRβ+ large intestinal LPLs expressing CD4 and CD8β from WT (n = 3) and DKO (n = 3) mice after 7 d of 2% DSS treatment and 7 d of recovery. Each dot represents an individual mouse. Gated on: Singlets CD45+ Live CD103+ CD11b− TCRβ+ cells. Representative FACS plot shown on the right. Error bars indicate mean ± SEM. Two-way ANOVA with Sidak’s multiple comparisons test (A), Student’s unpaired t test (B), multiple t tests with FDR correction (D–O). *, P < 0.05; ***, P < 0.001. Each dot represents a single mouse (B–O). Significance values for paired genotype comparisons from multivariate analyses are indicated with a vertical bar and appropriate P- or q-value (represented by asterisk) when appropriate. Significance values for multiple comparisons tests assessing day-to-day changes in weight loss between groups are indicated by P values next to individual data points if <0.05.

