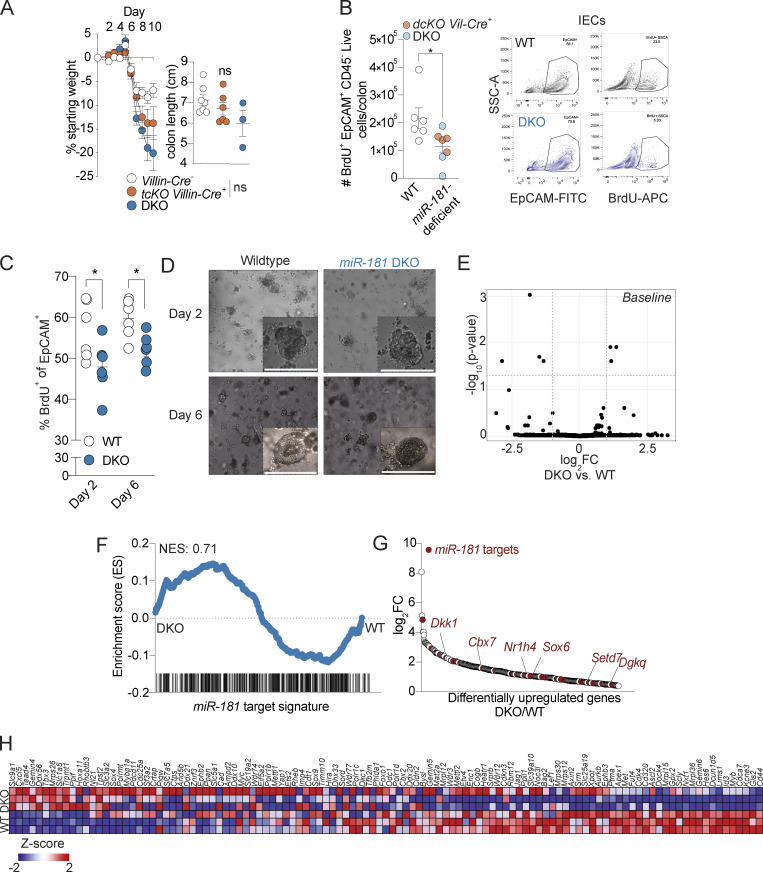
Figure S3.
miR-181 regulates the proliferative capacity of IECs. (A) Mean percent change in weight from day 0 (left) and colon length (right) of miR-181a1-b1f/f; miR-181a2-b2f/f; miR-181c-df/f; Villin-Cre− (n = 22), miR-181a1-b1f/f; miR-181a2-b2f/f; miR-181c-df/f; Villin-Cre+ (n = 14), and DKO (n = 12) mice treated with 2% DSS starting at 6–8 wk of age. DSS was withdrawn from all animals when DKO mice reached 7.5–10% weight loss. For colon length data, each dot represents an individual mouse. Data pooled from two independent experiments. (B) Quantification of in vivo BrdU incorporation in colonic IECs from WT (n = 3), miR-181a1-b1f/f; miR-181a2-b2f/f Villin-Cre− (n = 3), miR-181a1-b1f/f; miR-181a2-b2f/f Villin-Cre+ (n = 4), and DKO (n = 3) mice treated with DSS for 7–8 d and allowed to recover for 2 d. Mice were injected intraperitoneally with 100 mg/kg of BrdU and allowed to rest for 4 h prior to sacrifice. Colonic IECs were isolated and assayed for BrdU incorporation via flow cytometry. Each dot represents an individual animal. The gating strategy is shown on the right. Gated on: Singlets Live EpCAM+ CD45− BrdU+ cells. Data pooled from two independent experiments. (C and D) Percentage of in vitro BrdU incorporation in 3D colonoids derived from WT and DKO crypts after two or 6 d of plating. Representative images of day 2 and 6 colonoids are shown with a scale bar indicating 0.1 mm. The percentage of BrdU+ cells was quantified by flow cytometry at the indicated time points. Each dot represents an individual technical replicate derived from crypts pooled from two to three mice per group per experiment. Data pooled from two independent experiments. Gated on: Singlets EpCAM+ BrdU+ cells. (E) Volcano plot of genes expressed in colonic IECs derived from WT (n = 3) and DKO (n = 2) mice at steady-state as measured via RNA-seq. (F) GSEA of miR-181 targets expressed in colonic IECs derived from WT (n = 3) and DKO (n = 3) mice treated with DSS for 7 d and allowed to recover for 2 d as measured via RNA-seq. (G) Differentially upregulated genes in colonic IECs derived from DSS-treated DKO mice relative to WT DSS-treated mice as measured via RNA-seq. Predicted miR-181 targets are indicated by red dots. Within these targets, putative negative regulators of the Wnt pathway (Dkk1, Cbx7, Sox6, Nr1h4, Setd7, and Dgkq) are indicated by gene name in red. (H) Heat map of curated Wnt signature genes from Van der Flier et al. (2007) expressed in colonic IECs derived from WT and DKO mice treated with DSS. GSEA for this gene signature is shown in Fig. 5 L. Error bars indicate mean ± SEM. Unpaired t test (A), multiple t tests with FDR correction (C and D). *, P < 0.05.

