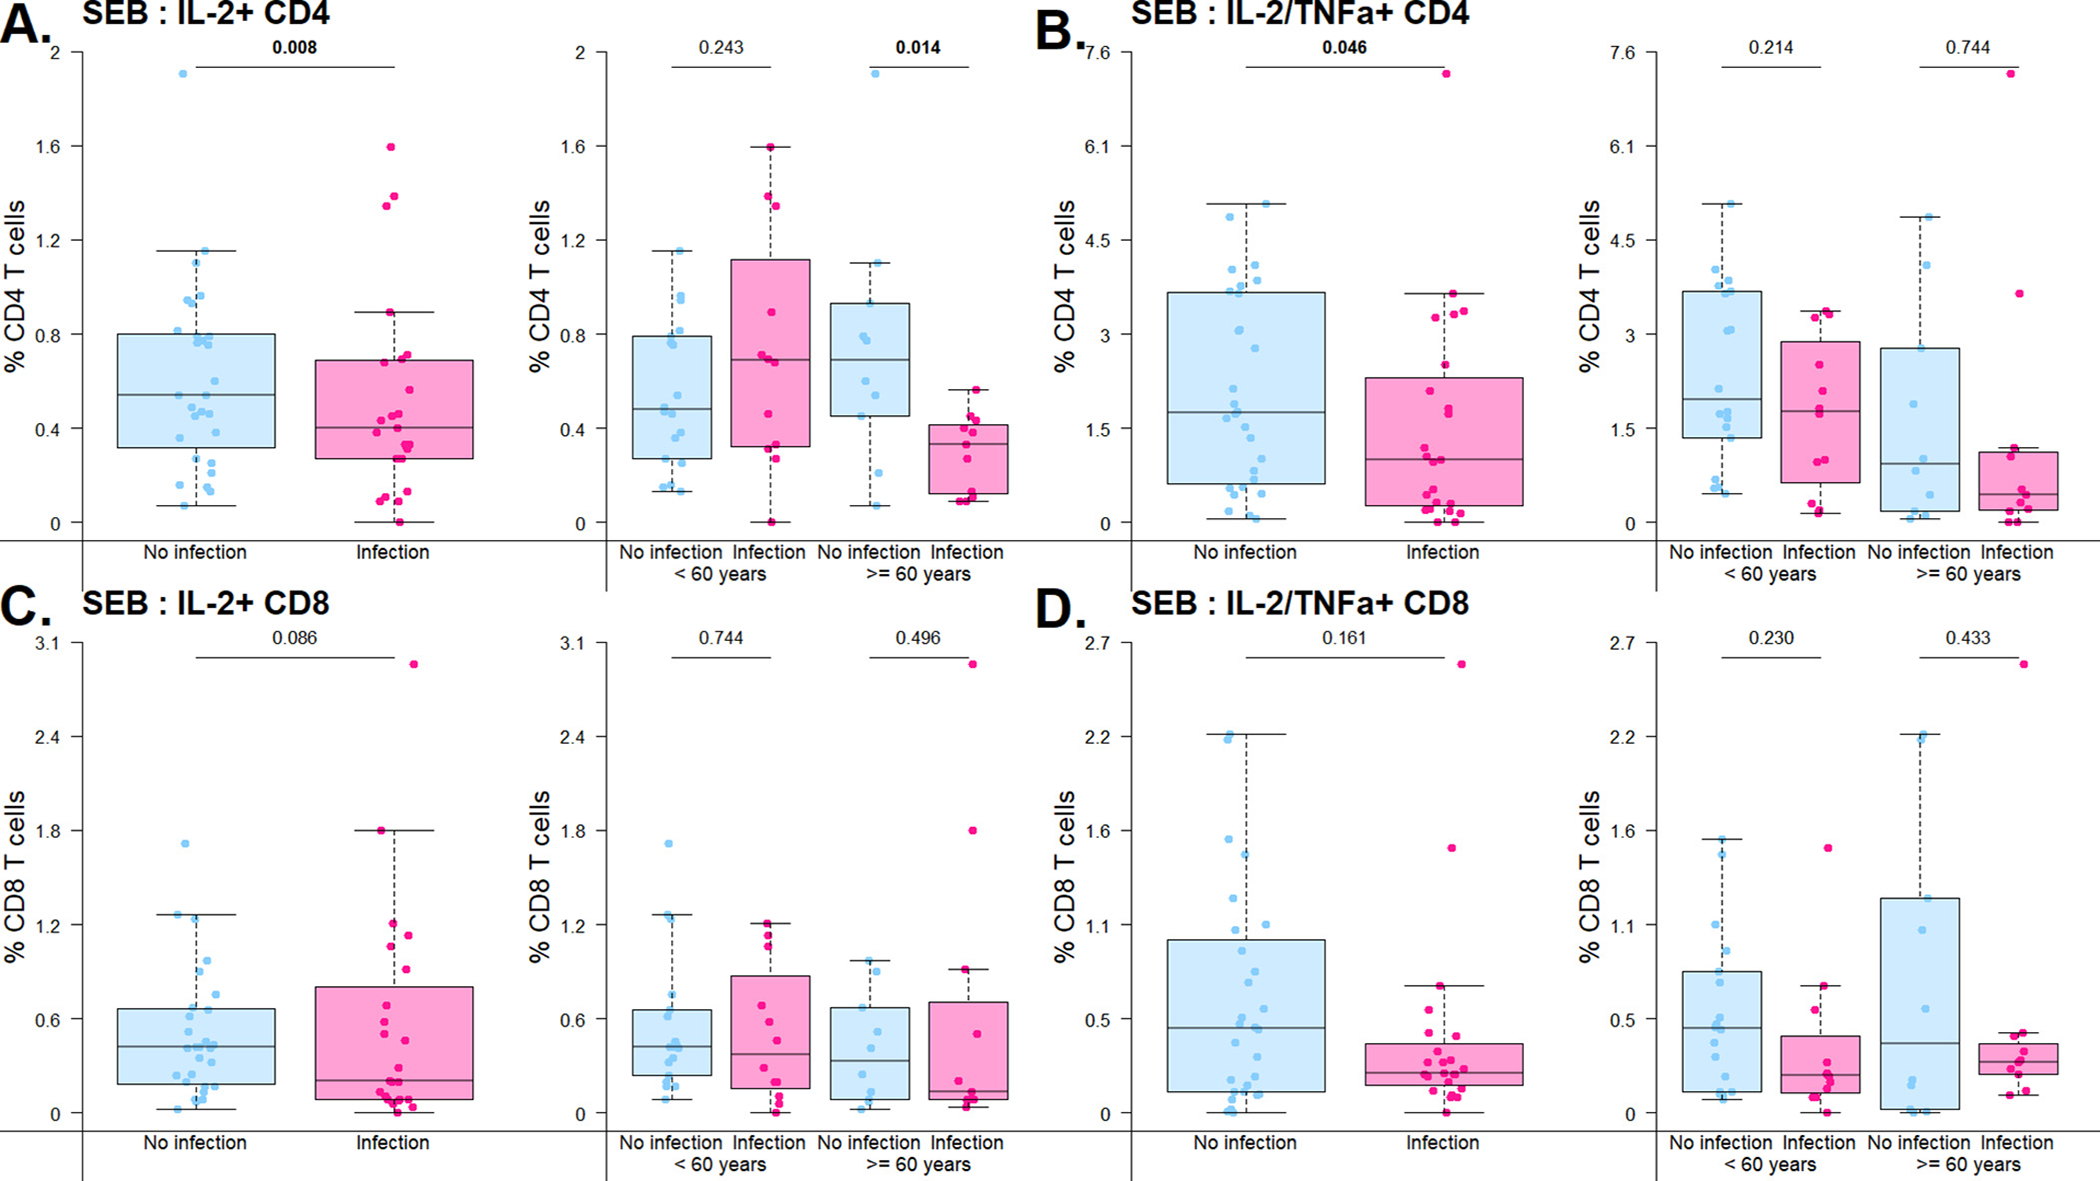
Fig. 1.

Frequency of cytokine-secreting cells detected after stimulation with SEB antigen. Bar and whiskers graph demonstrates median and IQR for patients with or without infection in the first year after kidney transplantation. Top panel represents CD4+ T cells and bottom panel represents CD8+ T cells. A) CD4+ T cell single cytokine secretion after stimulation with SEB, by overall cohort and by age group (<60 v 60 years old). B) CD4+ T cell double-cytokine secretion after stimulation with SEB, by overall cohort and by age group (<60 v ≥60 years old). C) CD8+ T cell single secretion after stimulation with SEB, by overall cohort and by age group (<60 v ≥60 years old). D) CD8+ T cell double-cytokine secretion after stimulation with SEB, by overall cohort and by age group (<60 v ≥60 years old). Analysis by linear regressions of subset percentage on infection status.
