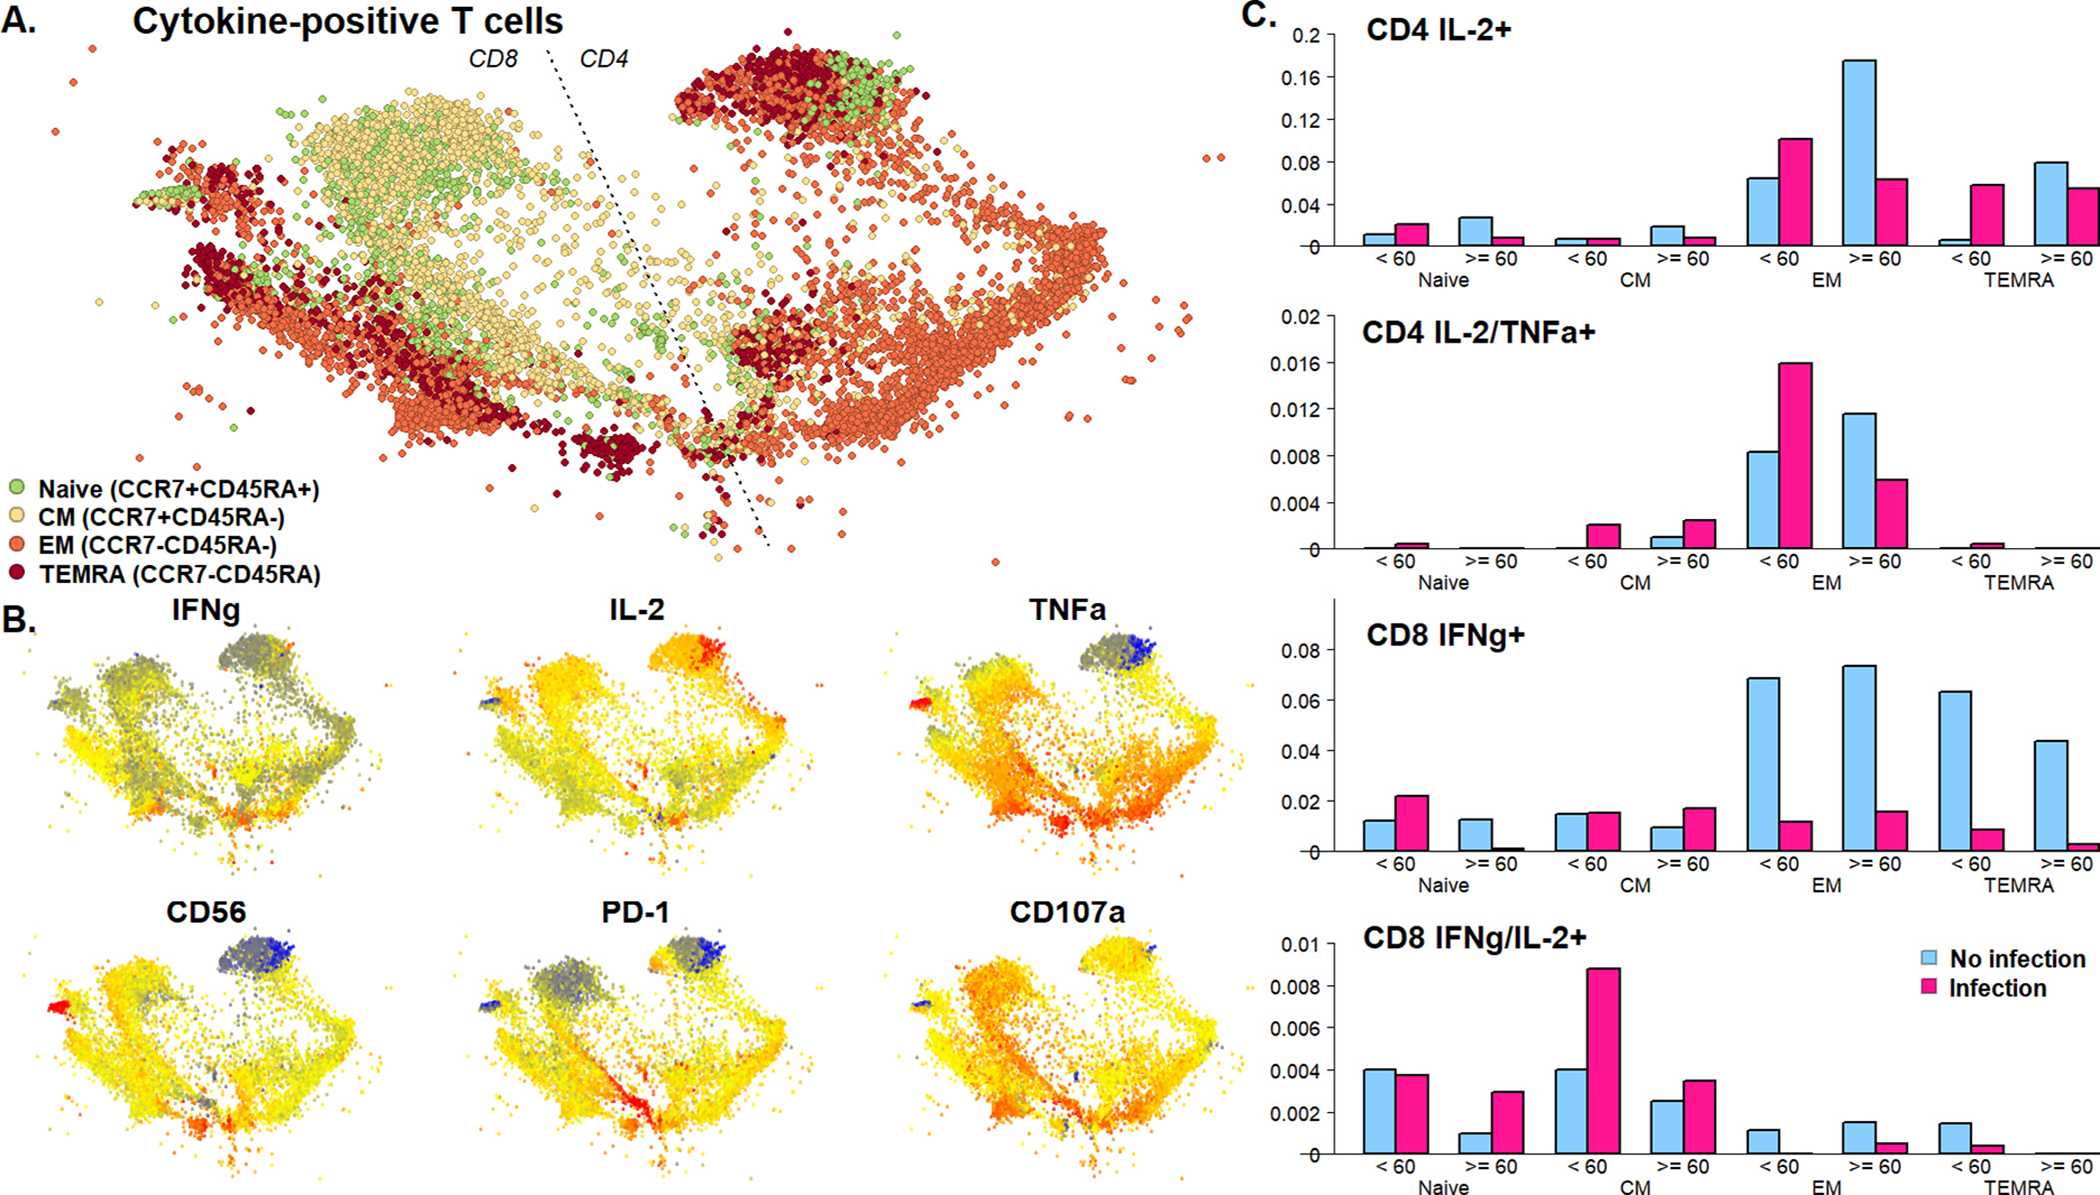
Fig. 3.

A) Spatialized t-SNE visualization of cytokine producing clusters of T cells. Total live cells were gated on CD4+ or CD8+ T cells producing at least one of IFNy, IL-2 and TNFa. Subsetted cells were assigned to 40 unsupervised clusters using the FlowSOM algorithm. For visualization, we further subsetted to 200 cells per sample. Expression of all markers was reduced to two dimensions by t-SNE followed by networks spatialization of cells using the ForceAtlas2 algorithm, with pairwise correlation of cells defining connectivity. Visualized cells are colored by cluster membership as shown. B) Normalized expression of surface markers and cytokines on spatialized t-SNE visualization. Raw MFI were arcsinh transformed with a cofactor of 150. Key indicates MFI low (blue) to high (red) intensity. C) Summed proportion of T cell maturation subtypes in single- and double cytokine-positive cells by infection status and age group.
